

Share of Wallet: Why Your Best Customers Still Have More to Give

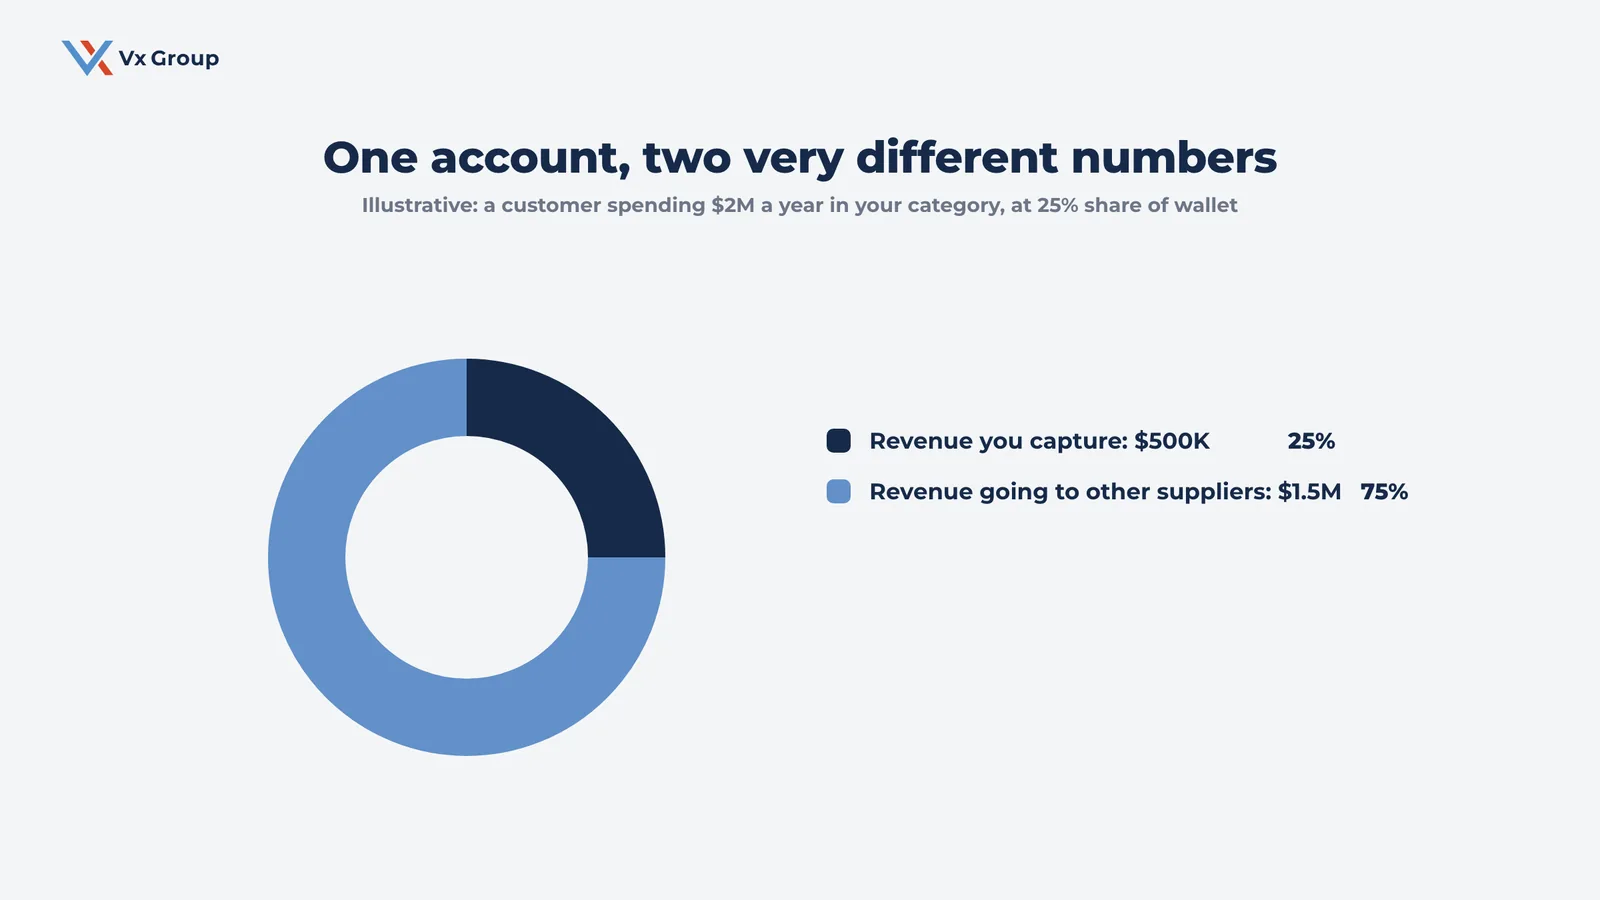
Share of wallet is the percentage of a customer’s total category spending that comes to you. A customer who buys $2 million of what you sell each year and sends you $500,000 has given you 25 percent share of wallet. The other 75 percent is budgeted, approved, and going to a competitor.
TL;DR
- Share of wallet measures how much of one customer’s category spend you capture. Most B2B companies track new-customer growth closely and carry no number for this at all.
- The formula is your annual revenue from the account divided by that account’s total annual category spend, times 100.
- You can estimate it accurately enough to act on without a data team. The fastest method is asking the customer directly in a structured review conversation.
- For companies with long-tenured customers, the revenue available inside the top 20 accounts usually exceeds the revenue available in the entire prospect list.
- An account at 25 percent share of a $2 million category spend holds $1.5 million of available revenue with a buyer who already trusts you.
- Market share and share of wallet answer two different questions. One tells you how you rank across a market. The other tells you how much of a single relationship you hold.
- Programs that work assign an owner per account, set a target percentage, and review the number quarterly with the same discipline applied to new business.
Most B2B companies can tell you, to the dollar, how much revenue a customer produced last year. Ask them what percentage of that customer’s total category spending they captured, and the room goes quiet. The number lives nowhere. It is on no dashboard, in no CRM field, and in no board packet.
That silence is the new-customer reflex at work. When growth flattens, the instinct is to go find more customers. Budget moves to the top of the funnel, the sales team gets a bigger prospect list, and the accounts already on the books get a renewal call and a holiday card. Meanwhile a customer who trusts the company, knows its people, and has already approved the spend is quietly buying three-quarters of what they need somewhere else.
Share of wallet is the number that makes that visible. It is one of the few growth metrics that costs almost nothing to estimate and changes what a leadership team prioritizes the moment it lands on the table.
What is share of wallet?
Share of wallet is the share of one customer’s category spending that comes to you, expressed as a percentage over a defined period. It answers a narrow, useful question: of every dollar this account spends on the kind of thing we sell, how many land with us?
Defined Term: Share of wallet.
The percentage of a single customer’s total spending in a defined product or service category that goes to one supplier over a set period, usually a year. Calculated as your revenue from the account divided by that account’s total category spend, multiplied by 100.
The reason most companies do not have this number is structural. Revenue reporting is built from invoices, and an invoice only records your half of the relationship. Your CRM captures what the customer bought from you. It has no field for what they bought from everyone else. So the reporting system produces a confident, complete, and badly incomplete picture: growth looks healthy because the account grew 8 percent, while the account’s total category spend grew 20 percent and a competitor absorbed the difference.
The concept originated in banking and financial services, where a customer’s total spending is comparatively easy to observe. That heritage still shows in most of the writing on the topic. For a manufacturer, distributor, or industrial services firm, the underlying question is identical and the arithmetic is harder, because nobody hands you the denominator. The rest of this guide is mostly about getting to a defensible denominator and then doing something with it.
How do you calculate share of wallet?
Divide your annual revenue from the account by that account’s total annual spend in your category, then multiply by 100.
Take a regional industrial supplier working with a food processing company. The supplier invoiced that customer $500,000 last year across pumps, valves, and replacement parts. In a planning conversation, the customer’s maintenance director mentions their annual MRO budget for that equipment category runs about $2 million. The math is $500,000 ÷ $2,000,000 × 100, which gives 25 percent share of wallet. The supplier is the smaller half of a relationship they had been describing internally as a key account.
The calculation is trivial. The work is in the three decisions that surround it.
Define the category before you touch the math
The denominator is only meaningful when the category is drawn tightly enough to be real. Define it as everything you sell and could plausibly sell to that customer within the next 18 months, and exclude everything you have no path to supply.
A supplier of hydraulic components should count the customer’s hydraulic spend. Counting their entire maintenance budget produces a flattering-looking 6 percent that means nothing, because most of that budget was never available. A category drawn too narrowly creates the opposite distortion: count only the exact three SKUs you already ship and you will land at 90 percent and conclude the account is finished.
Write the category definition down in one sentence per account, and use the same definition every year. A share of wallet number that moves because someone redefined the category is worse than having no number.
Estimate the account’s total category spend
You need the denominator, and no invoice will give it to you. Four sources, in order of reliability:
- The customer tells you. In a structured account review, most long-tenured customers will answer a direct question about category budget. This is the best source and the most underused.
- Their operating scale implies it. Plant count, line count, headcount, fleet size, square footage, and production volume all correlate to category consumption. If you serve 40 customers, you already have enough internal data to build a rough consumption-per-unit benchmark.
- Public and trade signals. Annual reports, capital expenditure announcements, expansion news, permit filings, and trade association benchmarks give you order-of-magnitude figures for larger accounts.
- Your own team’s field knowledge. Service technicians and drivers see competitor product on the shelf, in the plant, and on the loading dock. That observation is real data, and it is almost never collected.
Run the calculation on your top 20 accounts
Start with the top 20 by revenue. That set typically covers the majority of the revenue and takes a few hours to work through. A full customer base analysis is a project nobody finishes; 20 accounts is a Tuesday.
Build a one-page wallet map
Put the output in a single table so the leadership team reads it in one pass:
| Account | Your annual revenue | Est. category spend | Share of wallet | Confidence | Owner |
|---|---|---|---|---|---|
| Midwest Foods | $500,000 | $2,000,000 | 25% | High (customer stated) | J. Reyes |
| Cardinal Mfg | $310,000 | $500,000 | 62% | Medium (scale estimate) | T. Alvarez |
| Northline Co | $180,000 | $2,000,000 | 9% | Low (trade benchmark) | Unassigned |
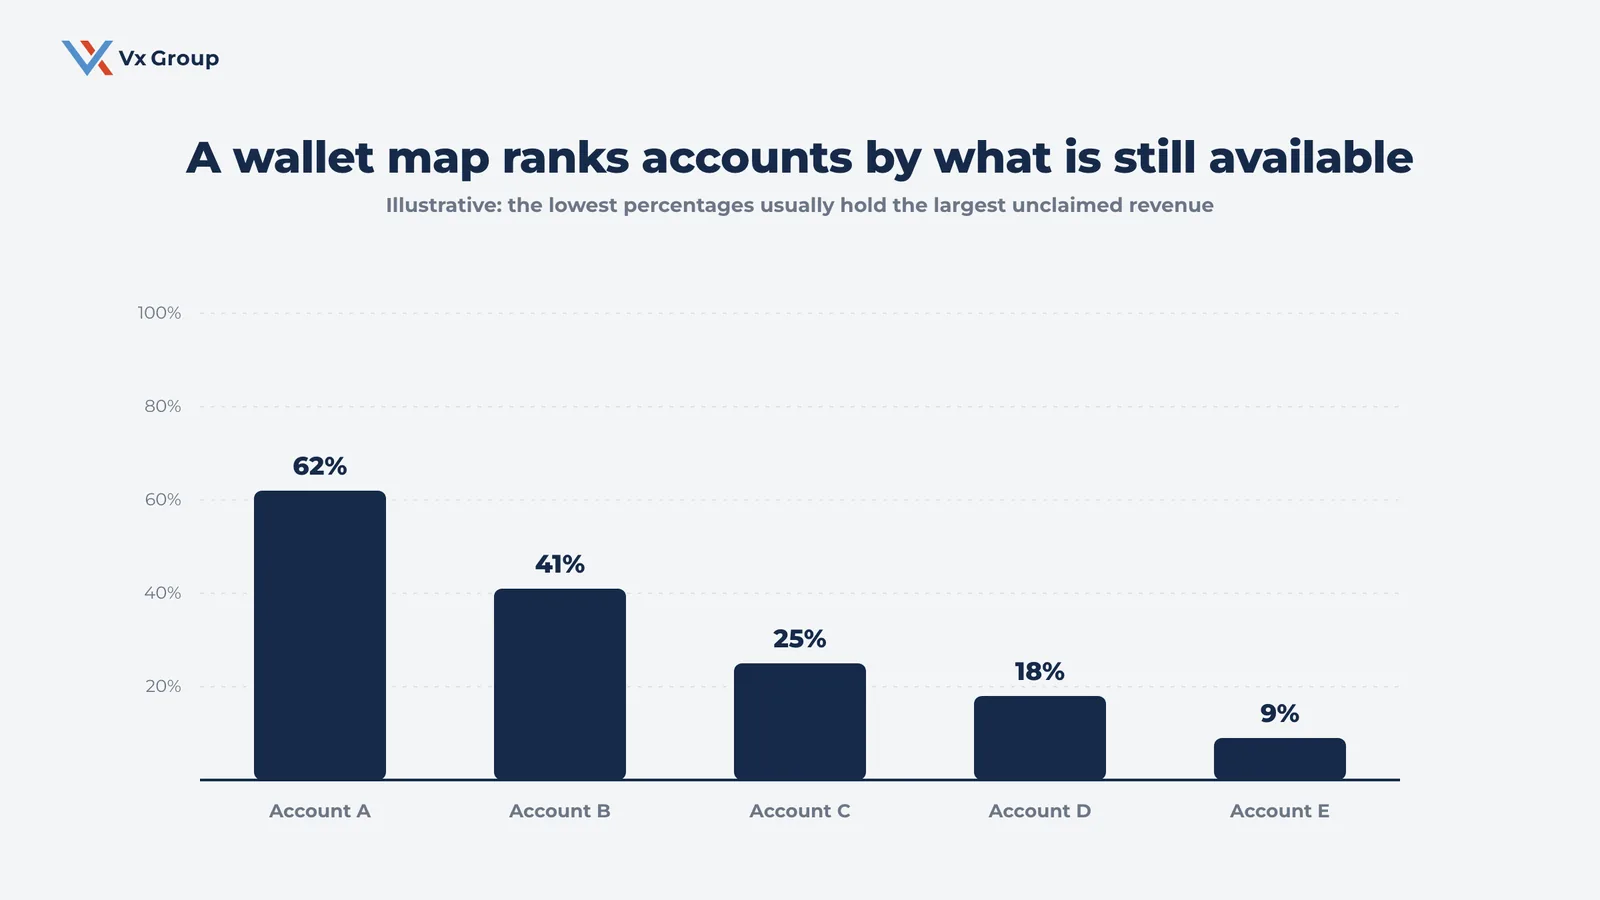
Sort that table by share of wallet ascending and the priority list writes itself. The account at the bottom of the percentage column is usually the largest available revenue in the company, and it is almost never the account getting the most attention.
How is share of wallet different from market share?
The two metrics answer different questions and are useful at different altitudes. Market share tells you how you rank across a defined market. Share of wallet tells you how much of one specific relationship you hold.
| Market share | Share of wallet | |
|---|---|---|
| The question it answers | How much of the total market do we hold? | How much of this customer do we hold? |
| Unit of measure | A market or segment | A single account |
| Where the data comes from | Industry reports, trade associations, estimates | Your invoices plus the account’s category budget |
| What it drives | Positioning, pricing, category investment | Account planning, coverage, expansion priorities |
| Who acts on it | Executive team, board | Account owners, sales leadership |
| How fast you can move it | Years | A quarter or two |
A company can hold 4 percent of its market and 70 percent of every account it serves. That company is dominant where it plays and has a growth path through new accounts. Another company holds 12 percent of the market and 20 percent of every account it serves. That company has a much larger opportunity sitting inside its existing customer list, and expanding there costs a fraction of what winning new accounts costs.
Both numbers are worth having. Share of wallet is the one that changes what an account manager does on Monday morning.
Why does share of wallet matter for relationship-driven B2B companies?
For companies with long sales cycles and long customer tenures, share of wallet is usually the cheapest revenue in the business. The trust has been built, the vendor approval is done, the terms are negotiated, the systems are connected, and the people know each other by name. Every one of those is a cost a new customer would make you pay again.
Consider what a new account actually costs a company with a nine to twelve month cycle: months of business development, a plant visit or two, a trial order, a quality audit, a vendor onboarding process, and a first-year margin often discounted to win the seat. Expanding an existing account at 25 percent share requires a conversation with someone who already returns your calls.
Vx Group works with companies where the top ten relationships represent decades of accumulated value. In that setting, three things follow from the wallet share number:
- The available revenue is larger than the pipeline. A company with 20 accounts averaging 30 percent share of wallet is looking at more addressable revenue inside its customer list than in its entire prospect list, at a fraction of the acquisition cost.
- Low wallet share is an early warning. A long-tenured account sitting at 15 percent uses you for one thing and has an established relationship with someone else for everything else. Tenure reads as loyalty on the org chart while the spending pattern says otherwise. When that customer consolidates suppliers, the incumbent holding 60 percent of the spend wins the decision.
- The number exposes concentration honestly. An account at 80 percent share has almost no room left to grow and every reason to be protected. Reading wallet share alongside customer concentration risk gives leadership a truthful picture of where revenue can expand and where it needs defending.
Field Notes:
A pattern shows up repeatedly in account reviews with industrial and distribution companies. A leadership team names its “top five customers,” and those five are ranked by revenue. When the same five are re-ranked by share of wallet, the order inverts. The largest account by revenue is frequently the one where the company already holds 70 or 80 percent of the spend, meaning it is close to maxed out. The third or fourth account, smaller on the invoice, turns out to sit at 20 percent of a much larger budget. The growth was in the account nobody was calling the most important one.
This is the same argument made in Account Expansion: The Growth Hiding in Your Best Accounts, with a specific number attached. Share of wallet is what turns “we should grow our existing accounts” into a ranked list with dollar figures on it.
How do you estimate share of wallet without a data team?
Ask the customer, then triangulate what they tell you against what you can observe. A useful estimate takes a single conversation per account and no new software.
The precision objection stops most companies before they start. A rough estimate that is directionally right changes behavior; a perfect number that nobody produces changes nothing. Aim for a figure you would defend within plus or minus 15 points, and improve it over time.
Ask the question directly in the quarterly review
Long-tenured customers answer this question more often than sales teams expect, particularly when it is framed around serving them better. Use a plain, unhedged version:
“We handle your pump and valve requirements. Roughly what does your total annual budget look like for that whole category, including what you buy elsewhere? I’m trying to understand how much of your program we’re actually supporting.”
Two things make this work. It is asked inside a structured review where the customer already expects business conversation, and it is framed as a coverage question. A quarterly business review is the natural home for it. Asked cold on a delivery call, it lands as a probe.
Record the answer, the date, and who gave it. That is your highest-confidence denominator.
Triangulate from the signals you already see
For accounts where the direct question is premature, build the estimate from observation. Give the account owner this checklist and a 30-minute window:
- What competitor product does our field team see on site?
- How many plants, lines, trucks, or facilities does this customer run, and how many do we currently supply?
- What is our consumption-per-unit benchmark across similar customers, applied to this customer’s scale?
- What has this customer announced publicly in the last 24 months regarding expansion, capital spending, or new capacity?
- Which product categories have they bought from us historically and stopped buying?
That last question is the sharpest one. A category the customer used to buy from you and no longer does is spend that moved, and it points at a specific competitor.
Score every estimate for confidence
Attach a confidence level to each denominator so the leadership team knows which numbers to act on and which to firm up. Three levels are enough:
| Confidence | Source | How to use it |
|---|---|---|
| High | The customer stated the figure directly | Set a wallet share target and build a plan against it |
| Medium | Derived from operating scale plus internal benchmarks | Act on it, and confirm with the customer within one quarter |
| Low | Trade benchmark or field inference only | Treat as a flag to investigate, do not build a forecast on it |
Set a refresh date and an owner
An estimate with no owner decays into trivia. Put a name against every account and a fixed refresh date, once a year at minimum. The refresh conversation is short: has the category budget changed, and has our share of it moved?
Ready to grow?
We help leadership teams build the wallet map for their top accounts and turn it into a ranked expansion plan.
What counts as a good share of wallet?
There is no universal benchmark, and any article that hands you one is guessing. What a good number looks like depends on how many suppliers the category structurally supports and what the customer’s sourcing policy allows.
Use the structure of the category to set the target instead:
- Sole-source categories (specialized equipment, engineered components, regulated materials) can reach 90 to 100 percent. Anything under 70 percent signals an active competitor with a real foothold.
- Dual-source categories (most industrial MRO, commodity inputs, packaging) cap around 50 to 60 percent by policy, because the customer deliberately maintains a second supplier. At 50 percent you are the primary and the realistic ceiling is close.
- Multi-source or bid-driven categories (freight, commodity chemicals, contract services) spread across three to six suppliers. Twenty-five to 35 percent may make you the largest single supplier in the account.
The practical rule: find out what the customer’s sourcing policy allows, then measure yourself against that ceiling. When policy caps any single supplier at 50 percent, a 45 percent share is close to a won account. In a sole-source category, that same 45 percent is a warning.
Two decision rules make the number operational:
- Any top-20 account under 30 percent gets a named expansion plan this quarter. The gap is large enough to matter and the relationship already exists.
- Any top-20 account over 70 percent gets a retention plan and no growth target. The revenue is concentrated, the upside is thin, and the downside is severe. Pair this with customer retention strategies built for relationship-driven companies.
How do you grow share of wallet inside an account you already have?
Growth in an existing account comes from reaching buying centers you have never met, removing the friction that sends volume elsewhere, and timing the ask to the customer’s own planning calendar. Five plays, in the order they usually pay off.
Map the buying centers you have never met
Most low wallet share traces to relationship coverage. You have one strong contact in one department, and the rest of the spend is decided by people who have never heard your company’s name.
Build a one-page contact map per account: every department that touches your category, the named decision maker in each, the last date anyone from your company spoke with them, and who owns that relationship going forward. The blank rows are your plan. A single account with four plants and one relationship at one plant is not a 25 percent account by accident.
This is the same coverage problem described in founder-dependent sales, scaled down to the account level.
Price the second category before the customer asks
Customers rarely volunteer that they would consider buying more from you. They assume you sell what you have always sold them.
Pick the adjacent category with the largest estimated spend, build a specific proposal for it, and bring it to the next review unprompted. Include the volume you believe they consume, what you would charge, and what changes operationally if they consolidate. A proposal the customer did not request signals that you understand their operation, and it puts a number on the table that a competitor now has to beat.
Fix the reorder friction that sends volume elsewhere
A meaningful share of lost wallet is logistical. The customer needed something on Thursday, your lead time was two weeks, and they called someone else. That one call becomes a standing relationship.
Ask the account owner to list every instance in the last year where the customer went elsewhere for something you sell. Then sort the list by cause: lead time, minimum order quantity, product breadth, service coverage, quoting speed. Fixing the top cause usually recovers more revenue than a new sales campaign.
Put a named owner on the gap
Assign each low-share account an owner and a target percentage with a date. “Grow Northline from 9 percent to 20 percent by Q3” is a goal someone can be held to. “Focus on account growth” is a sentiment.
Write the target into the account plan and review it on the same cadence as new business. If wallet share never appears in a pipeline meeting, the organization will treat it as optional, because it is being treated as optional.
Sequence the ask to the customer’s planning calendar
Category budgets get set on a calendar. Bringing an expansion proposal three weeks after the customer locked next year’s supplier allocation wastes a good proposal.
Find out when each top account sets its budget for your category and work backward 60 days. That is when the conversation happens. Put the date in the CRM alongside the wallet share figure.
What should you track alongside share of wallet?
Share of wallet on its own can be gamed and misread, so pair it with four metrics that keep it honest.
| Metric | What it measures | Why it belongs next to wallet share |
|---|---|---|
| Category spend growth | Whether the account’s total budget is expanding or shrinking | Your share can rise while your revenue falls if the customer’s budget contracts |
| Relationship coverage | Named contacts per buying center, and how recently each was engaged | Low coverage explains most low wallet share and is the fixable input |
| Product line penetration | How many of your categories the account buys | The clearest early signal that wallet share is about to move |
| Revenue concentration | Share of company revenue in the top five accounts | High wallet share plus high concentration reads as a win and behaves like a risk |
Track these quarterly on the same page as the wallet map. Four numbers per account is a review a leadership team will actually run.
The pairing that matters most is wallet share against relationship coverage. When both are low, the account is an expansion opportunity with a clear first step. When wallet share is low and coverage is already high, something operational is sending spend elsewhere. Look at lead times, product breadth, and pricing first, because more relationship work will not move an account that leaves for a two-week lead time.
Where do share of wallet programs go wrong?
Five failure modes account for most abandoned efforts:
- Chasing precision before starting. Teams spend a quarter building a methodology for a number that only needs to be roughly right. Estimate the top 20 in an afternoon, act on it, and refine later.
- Redefining the category to make the number look better. A denominator that shifts every year makes trend analysis impossible. Lock the definition per account and keep it.
- Measuring it and assigning nobody. The wallet map gets built, presented, admired, and filed. Every account needs an owner, a target, and a date.
- Treating high share as finished. An account at 80 percent has the least growth headroom and the most revenue at risk. High share earns a protection plan and executive attention.
- Running it as a sales metric only. Wallet share moves when operations, service, and product decisions change. Keeping it inside the sales function limits it to the plays sales can run alone.
The pattern under all five is treating the number as reporting. Share of wallet earns its place when it changes account priority, coverage assignments, and where the next dollar of effort goes.
Where to start
Pick your top 20 accounts. For each one, write a single sentence defining the category, then estimate that account’s annual spend in it using the best source you have. Divide your revenue by that figure. Sort the list ascending.
You will have a wallet map in an afternoon and a ranked expansion list by the end of the week. The three accounts at the bottom of that list are almost certainly the largest revenue opportunities in the company, sitting with customers who already trust you.
Then do the harder part: put a name and a target percentage on each of those three, and review the number every quarter with the same seriousness applied to the new business pipeline. The companies that grow wallet share are the ones that made it somebody’s job.
Ready to grow?
We build the wallet map with your leadership team and turn it into an account expansion plan with owners and targets.
FAQs
About the Author: Jacob Camhi
