

Trade Show Metrics That Actually Prove ROI

The trade show metrics that predict revenue are target-account meetings booked, qualified conversations held, cost per qualified conversation, existing-customer touches, new named contacts inside target accounts, meeting-to-opportunity conversion, follow-up completion within 10 days, pipeline influenced in dollars, and closed revenue attributable to the show.
TL;DR
- Booth traffic, badges scanned, and total lead count measure how busy the aisle was and predict nothing.
- Nine metrics actually connect a show to revenue, and seven of them are available inside two weeks of the show closing.
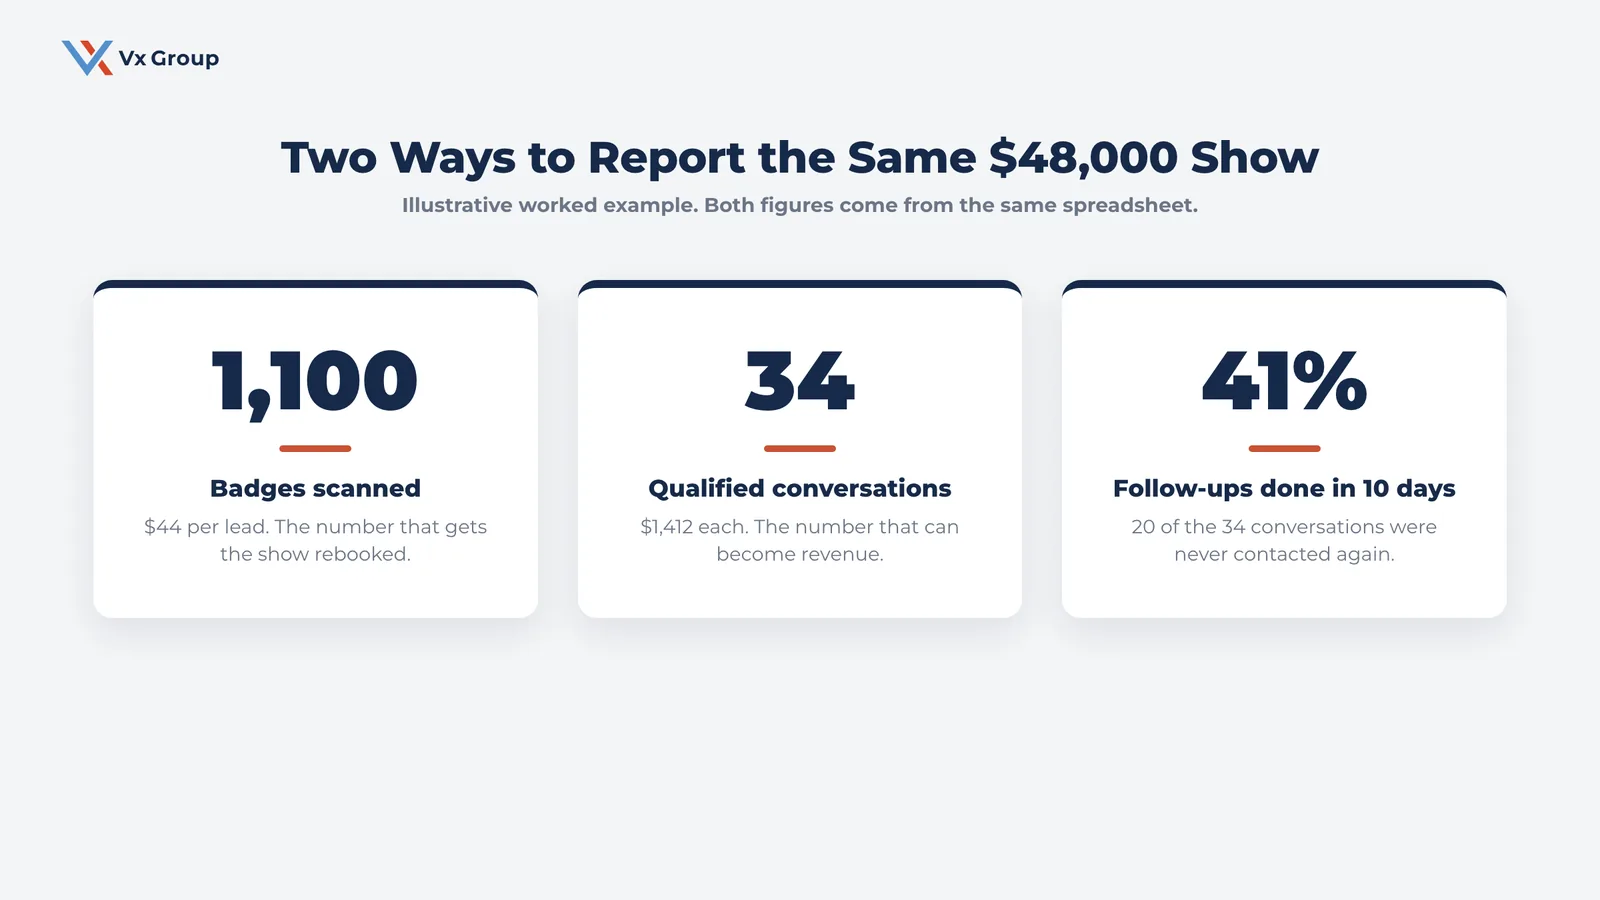
- Cost per qualified conversation is the number that reframes the whole budget conversation. In our worked example it runs $1,412 while cost per scanned badge reads $44.
- Follow-up completion within 10 days recovers more value than anything else on the list, and most exhibitors sit under 50 percent.
- Start with three: target-account meetings booked, qualified conversations held, and follow-up completion within 10 days.
Why do exhibitors keep measuring the wrong things?
Because the wrong things are easy to count and available the same afternoon. A badge scanner produces a number. A booth counter produces a number. Both numbers are large, both arrive immediately, and both can be put on a slide before the team flies home. The metrics that matter take between two weeks and fourteen months to resolve, and most of them require someone to have decided in advance who the show was for.
There is a second reason, and it is structural. The team that books the booth is frequently measured on attendance and activity, while the revenue shows up later on someone else’s report. Nobody is deliberately gaming anything. The measurement system just rewards the aisle count.
The cost of that is real. A company spending $48,000 to exhibit and reporting 1,100 scanned badges will calculate $44 per lead, conclude the show performed well, and rebook it. The same show produced 34 conversations worth having, which is $1,412 each. Whether that is a good number depends entirely on what those 34 conversations turned into, and almost nobody follows the thread far enough to know.
Defined Term: Vanity metric.
A number that is easy to collect, moves in a flattering direction with more activity, and has no demonstrated relationship to revenue. Booth traffic, badges scanned, and total lead count are the three most common vanity metrics in trade show reporting.
The nine metrics below fix that. Each one includes what it measures, how to calculate it, and a worked example from a single $48,000 show so the numbers stay comparable as you read.
1. Target-account meetings booked before the show opens
This is the metric that separates a show with a plan from a show with a booth. Count the meetings with named target accounts that were scheduled and confirmed before the doors opened, and count how many were actually held.
How to calculate it. Build the target list four to six weeks out: existing customers you want to see, accounts you have been trying to reach, and prospects you know are attending. Book meetings by name. After the show, report two numbers, meetings booked and meetings held, plus the hold rate between them.
If you have never built a target list this way, the ideal customer profile template gives you the criteria to pick the accounts worth booking.
Worked example. In our $48,000 show, the team booked 18 target-account meetings in advance and held 15, a hold rate of 83 percent. Those 15 conversations are the reason the show worked. The other 1,085 badge scans contributed one opportunity between them.
Why this beats the vanity version. Total lead count answers “how many people walked past.” Meetings booked answers “did we get in front of the specific companies we care about,” which is the only question a show can be held accountable for in advance. A team that books zero meetings before a show has decided to let the aisle choose their customers.
2. Qualified conversations held
Count the conversations that met a written qualification bar, and nothing else. This is the number that should replace “leads” in every show report your company produces.
How to calculate it. Define the bar before the show and write it down. A workable standard for most relationship-driven B2B companies: the conversation lasted more than five minutes, you learned a specific application or problem, you know the person’s role in a buying decision, and there is a named next step. All four, or it does not count.
Worked example. The $48,000 show produced 1,100 scanned badges and 34 conversations meeting all four criteria. Both numbers are accurate. Only one of them is useful.
Why this beats the vanity version. Badge scans measure a hand movement. A qualified conversation is the smallest unit of trade show work that can plausibly become revenue. Reporting 34 instead of 1,100 feels like bad news the first year and it makes every subsequent decision better, because now the team knows what it is actually producing per show.
3. Cost per qualified conversation
Take the fully loaded cost of the show and divide it by qualified conversations. This single number reframes the trade show budget conversation more than any other metric on this list.
How to calculate it. Fully loaded means everything: booth space, build and refresh, freight, shipping, travel, hotels, meals, giveaways, and the loaded cost of every hour your staff spent on the floor and in transit. Divide that total by the qualified conversations from metric 2.
Worked example. $48,000 divided by 34 qualified conversations is $1,412 per conversation. The same show reported against scanned badges reads $44 per lead. Both come from the same spreadsheet.
Why this beats the vanity version. At $44 a lead, a show looks like the cheapest channel in the business and no one examines it. At $1,412 a conversation, leadership asks the right question, which is whether those conversations produce more than a $1,412 investment elsewhere would. For many manufacturers the honest answer is yes, and the number holds up. The point is that the question finally gets asked.
4. Existing-customer touches completed
Count the conversations with current customers, scheduled in advance, that happened at the show. Most exhibitors treat their own customers as a distraction from prospecting, which inverts where the value is.
How to calculate it. Before the show, list the existing customers attending and pick who you want to see. Book them. Afterward, count touches completed and note what came out of each: an expansion conversation, a problem surfaced, a referral, or a renewal signal.
Worked example. The team booked and completed 22 existing-customer touches at the $48,000 show. Two surfaced expansion opportunities, one surfaced a service problem nobody had escalated, and one produced an introduction to a sister division.
Why this beats the vanity version. New lead count treats the show as an acquisition event. The lifetime value concentrated in a company’s existing relationships almost always exceeds the pipeline of strangers walking the aisle, and a trade show is the cheapest place all year to see 22 of them face to face. The account expansion piece works through why that math usually favors the customers you already have, and your top 10 customers are a growth strategy covers how to pick which ones to see first.
5. New named contacts added inside target accounts
Count the individuals you did not previously know, inside accounts that matter, whose name, role, and interest you can now put in a record. This is the metric that measures whether a show made your relationships less fragile.
How to calculate it. For each target account, count the contacts you had a real conversation with who were not in your system before the show. Report it per account, because five new contacts spread across five accounts is a different result from five new contacts at one.
Worked example. Across 15 target-account meetings, the team added 9 new named contacts, including two at an account where the entire relationship had run through one purchasing agent for six years.
Why this beats the vanity version. A single-threaded account is a relationship that ends when one person changes jobs, which is the exposure described in what is a generational customer. Trade shows are unusually good at fixing that, because three people from the same company walk the floor together and you can meet all of them in twenty minutes. No badge-scan report will ever tell you that happened.
Ready to grow?
We help exhibitors build the target list and the measurement before the booth gets ordered.
6. Meeting-to-opportunity conversion rate
Measure the share of qualified conversations that became a real opportunity in your pipeline within 90 days. This is the first metric on the list that tests conversation quality, and it is where a well-planned show separates itself from a busy one.
How to calculate it. Tag every qualified conversation with the show name in your CRM. Ninety days later, count how many became opportunities under your normal definition, and divide by the qualified conversations. Do the same for the target-account meetings separately, because those two rates are usually very different.
Worked example. Of the 15 target-account meetings held, 6 became opportunities inside 90 days, a 40 percent conversion. Of the 19 other qualified conversations, 1 became an opportunity, a 5 percent conversation-to-opportunity rate.
Why this beats the vanity version. That gap, 40 percent against 5 percent, is the entire argument for pre-booking meetings, and it only becomes visible when you segment the two groups. A blended rate of 21 percent across all 34 conversations would have hidden the most useful finding from the whole show. Define “opportunity” the same way you do everywhere else, using the stage definitions in sales cycle stages, so the show is measured on the same terms as the rest of the pipeline.
Defined Term: Meeting-to-opportunity conversion rate.
The share of qualified show conversations that become pipeline opportunities within 90 days, reported separately for pre-booked target-account meetings and for conversations that started at the booth.
7. Follow-up completion rate within 10 days
Measure the percentage of next steps committed to on the show floor that were actually completed inside 10 days. This is where most trade show value is lost, and fixing it recovers more revenue than anything else on this list.
How to calculate it. Every qualified conversation should end with a named next step. Log it at the show, with an owner and a promised date. Ten days after the show closes, count completions against commitments. Report it by person, because the variance between individuals is usually large and always instructive.
Worked example. The team committed to 34 next steps. Fourteen were completed inside 10 days, a 41 percent completion rate. The other 20 conversations went to a list, then to a busy month, and the majority were never contacted at all.
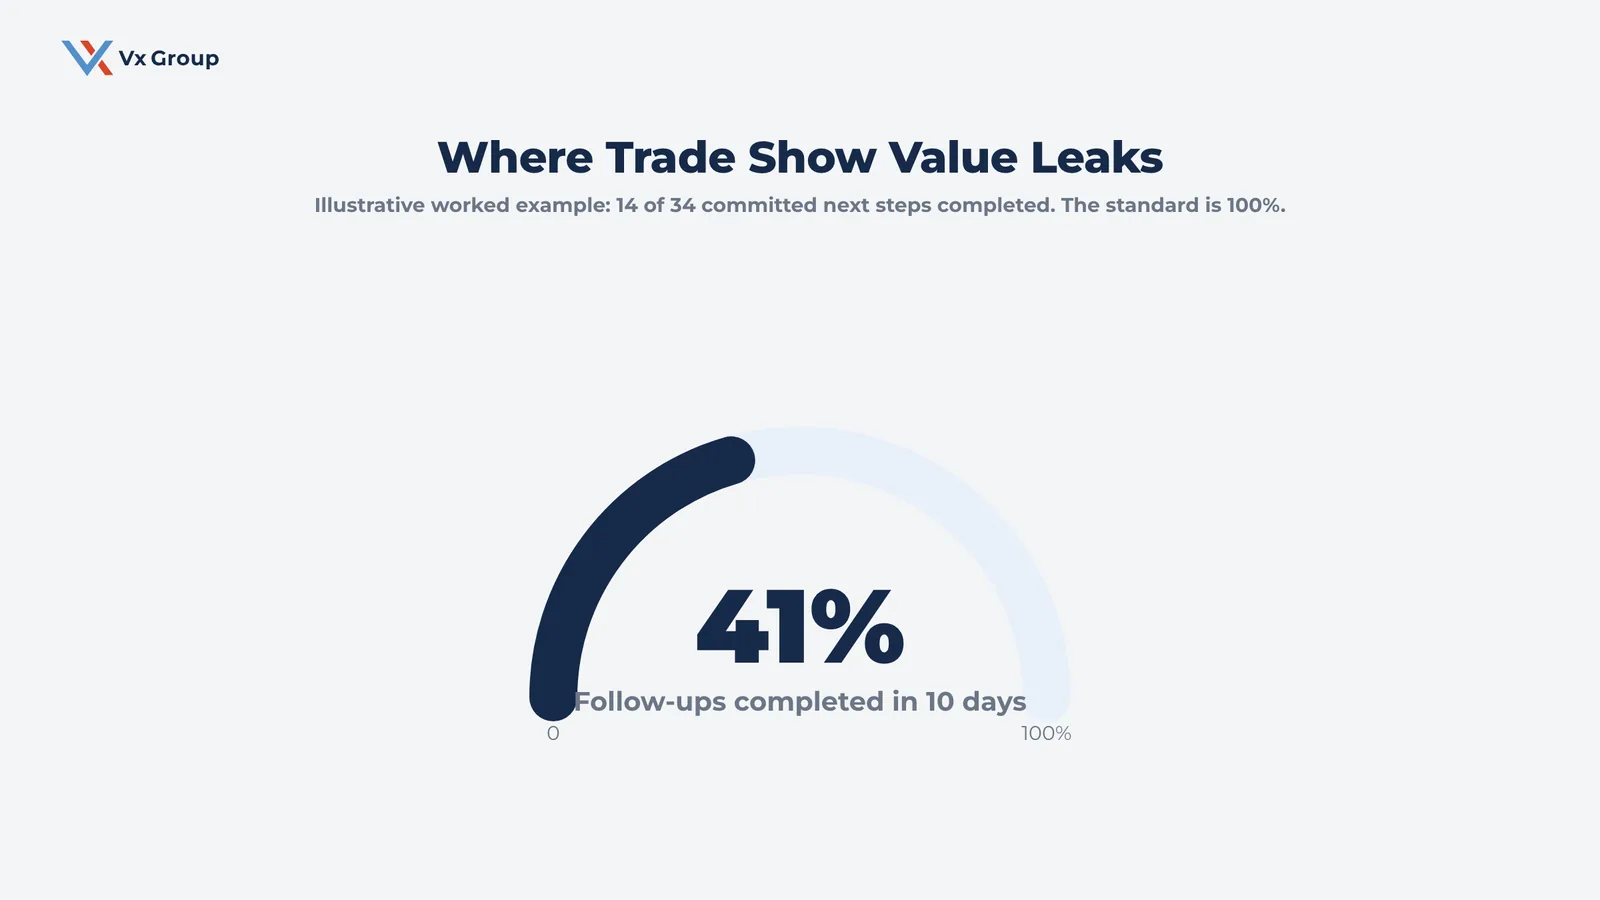
Why this beats the vanity version. Nothing else in this article recovers as much value as fixing this one number. The company already paid $48,000 to have those 34 conversations. Letting 20 of them go cold is the most expensive thing that happens after a trade show, and it happens quietly, in the two weeks when everyone is catching up on the work they missed while traveling. Ten days is the right window because attention decays fast and a two-week-old show conversation is already hard to restart. The wider case for this sits in how to measure trade show effectiveness.
Ready to grow?
Bring last year’s show numbers and we will rebuild the report with you.
8. Pipeline influenced, in dollars
Add up the value of every opportunity that had a show conversation in its history, and report it as a dollar figure against the show’s cost. This is the metric that lets a trade show compete for budget on the same terms as every other growth investment.
How to calculate it. Sum the opportunity value of everything the show touched, whether the show created the opportunity or advanced one already in flight. Report influenced pipeline and created pipeline as two separate lines, because a show that advances 11 existing deals is doing real work that a “created” number erases.
Worked example. Six new opportunities at an average of $95,000 gave $570,000 of created pipeline. The show also touched four in-flight opportunities worth $310,000 combined, where a face-to-face conversation moved a stalled deal. Influenced pipeline: $880,000 against a $48,000 cost.
Why this beats the vanity version. A lead count cannot be compared to anything. A dollar figure can be set beside what the same $48,000 would have produced in outbound, paid search, or an extra salesperson, which is exactly the comparison a president or an owner needs to make when deciding whether to rebook. Tagging show conversations through to close is the same hygiene that makes sales pipeline management work at all.
9. Closed revenue attributable to the show
The final number, and the one that takes longest to arrive: revenue from deals whose history includes a show conversation. In a project business this lands 9 to 18 months after the show closes.
How to calculate it. Keep the show tag on the opportunity through close. Report closed-won revenue by show, and report it on a rolling basis so last year’s show is still being credited as deals land. Most companies stop attributing at 6 months and undercount their own results by half.
Worked example. Fourteen months after the $48,000 show, two deals had closed for $210,000 combined, a 4.4x return on the show cost, with two more opportunities still open. The report written the week after the show would have shown 1,100 leads and no revenue at all.
Why this beats the vanity version. This is the only metric on the list a finance leader treats as proof. It is also useless on its own, because it arrives far too late to change anything. That is the case for the other eight: they are the leading indicators that let you improve a show while you can still act, and this one confirms whether the improvements worked.
Which three trade show metrics should you start with?
Start with target-account meetings booked, qualified conversations held, and follow-up completion within 10 days. Those three are cheap to collect, available inside two weeks, and between them they cover the three places a show is won or lost: who you planned to see, how many conversations were worth having, and whether anyone followed up.
| Metric | Available when | Effort to set up | Why it earns a place in the first three |
|---|---|---|---|
| Target-account meetings booked | Before the show opens | Low. A named list and a calendar | Forces a plan. A show with no booked meetings has no plan |
| Qualified conversations held | Within 2 days of close | Low. A written four-part bar and a tally | Replaces “leads” with a number that can become revenue |
| Follow-up completion within 10 days | 10 days after close | Low. A logged next step per conversation | Recovers the most value for the least work |
Add cost per qualified conversation at the next show, because it needs the qualified conversation count to exist first. Add the conversion, pipeline, and closed revenue metrics once your CRM is tagging show conversations reliably. The full set takes about three shows to build, and each one works on its own in the meantime.
The trade show program page and the trade show ROI guide cover the planning side of this, including how to build the target list that metric 1 depends on.
What a trade show report should look like
One page. Nine numbers, the show cost, and three sentences of judgment. Something close to this:
- Fully loaded cost: $48,000
- Target-account meetings booked / held: 18 / 15
- Qualified conversations: 34
- Cost per qualified conversation: $1,412
- Existing-customer touches: 22
- New named contacts in target accounts: 9
- Meeting-to-opportunity, pre-booked: 40 percent. Booth conversations: 5 percent
- Follow-up completion within 10 days: 41 percent
- Pipeline influenced: $880,000. Created: $570,000
- Closed revenue at 14 months: $210,000
Then three sentences: what worked, what to change, and whether to rebook. A report like this settles the rebooking argument in about four minutes, which is roughly four minutes faster than any report built on badge scans has ever settled it.
Measure the show you actually ran
A trade show is a compressed opportunity to sit down with the specific people who decide whether your company grows. An aisle count will describe the same busy week back to you every year. The nine numbers above turn the show into a channel you can improve deliberately, one decision at a time: a better target list, a tighter qualification bar, a follow-up window somebody owns.
Pick the three starter metrics and run them at your next show. The first honest cost per qualified conversation is uncomfortable, and it is the number that starts every useful trade show conversation a leadership team has ever had.
Ready to grow?
We build trade show programs where the measurement is decided before the booth is ordered.
Subscribe to Insights → New articles on relationship-driven B2B growth, roughly weekly.
FAQs
About the Author: Jacob Camhi
