

The Ideal Customer Profile Template Every B2B Marketer Should Use

A relationship-weighted ideal customer profile template scores every account on four categories: relationship quality, expansion potential, strategic value, and firmographic fit. Weighting relationship quality and expansion potential the heaviest predicts which accounts will actually stay, grow, and refer, with far more accuracy than revenue size alone.
TL;DR
- A firmographic-only ICP template describes company size. A relationship-weighted template predicts which accounts stay, expand, and refer.
- Pull 8 to 12 generational customers using independent leadership nominations plus a CRM pull on tenure and lifetime revenue.
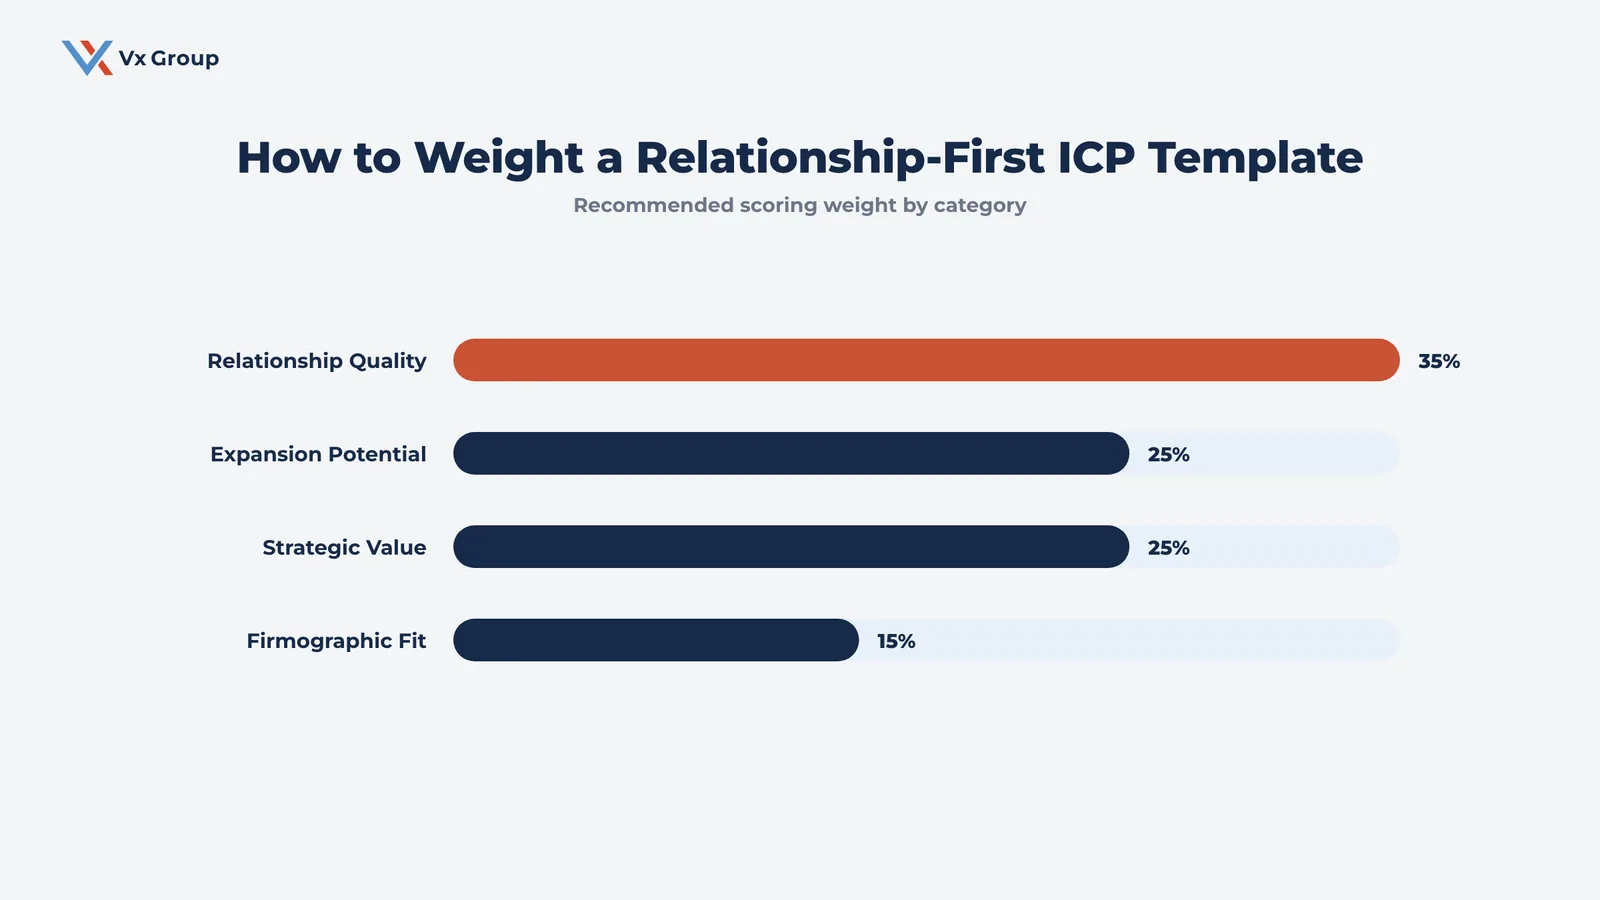
- Score every account on four categories: relationship quality (35%), expansion potential (25%), strategic value (25%), and firmographic fit (15%).
- Use the weighted-score formula and four decision bands to turn raw scores into a Pursue, Protect, Monitor, or Deprioritize call.
- Run your entire current book of business through the template before using it to screen a new prospect.
- Wire a minimum score threshold into your CRM so sales can’t advance an opportunity without a completed score.
- Put a recurring 90-minute session on the leadership calendar every two quarters to re-score the book.
Most ideal customer profile templates you can find online are demographic checklists, similar to generic customer segmentation models: revenue range, employee count, industry vertical, done. They produce a profile that describes company size while saying nothing about which relationships will actually compound.
You need three things before you start: export access to your CRM or accounting system, one uninterrupted hour with your full leadership team, and a shared spreadsheet. Nothing else is required to run this process end to end.
This approach comes directly from the Ideal Profiles workshop inside Vx Group’s Measured in Millions® methodology, where a leadership team’s shared pattern recognition defines who a company is actually built to serve.
Step 1: Pull your generational customers before you touch a spreadsheet
Start with 8 to 12 of your longest-standing, highest-value customer relationships. Vx Group calls these Generational Customers™, the accounts that have compounded value over years and reveal the real pattern behind your growth.
Defined Term: Generational Customer
A customer relationship that has compounded in value over years through repeat business, expansion, or referrals, and reveals a pattern the business can design for again.
Send this exact prep message to your leadership team
Send this message to every member of your leadership team a week before the workshop, and ask each person to reply on their own without comparing notes with anyone else first.
Before we get in a room together, I want your honest list. Name the 3 to 5 customer relationships you’d protect first if you could only keep a handful. For each one, add one sentence on why it made the list. Reply directly to me.
Independent replies surface disagreement before the workshop instead of during it. Two leaders naming completely different accounts is itself useful information about how unevenly relationship knowledge is distributed across the team.
Pull a second list straight from your CRM or accounting system
Run two reports before the workshop: your top 15 accounts by tenure and your top 15 accounts by lifetime revenue. Any account that shows up on both reports, and on a leader’s nominated list, goes straight into your final 8 to 12.
Write down each relationship and why it has lasted
Write down the name of each account alongside one sentence on why it has lasted. Skip any customer that showed up once and never came back.
Add a firmographic baseline for each account
For each relationship, capture headquarters location, revenue range, employee count, core products purchased, and primary industry. Pull it from your CRM or a tool like ZoomInfo.
| Account | HQ region | Revenue range | Employees | Core product | Industry |
|---|---|---|---|---|---|
| Account A | Midwest | $2M to $5M | 40 to 60 | Custom metal fabrication | Industrial equipment |
| Account B | Southeast | $10M to $20M | 150 to 250 | Distribution and logistics | Building products |
| Account C | Midwest | $500K to $1M | 10 to 20 | Specialty parts | Automotive aftermarket |
This baseline won’t explain why a relationship worked. It gives you something concrete to check assumptions against once leadership starts talking in Step 2.
If you don’t have 10 years of history, substitute intensity for tenure
A company under five years old rarely has a decade of relationships to draw from. Substitute intensity for tenure: score accounts that expanded fastest, referred the most, or weathered a real problem without leaving, once you have at least six months of observed behavior to judge them on.
Step 2: Interview leadership about why your best relationships work
Get the CEO, President, and full leadership team in one room to walk through each generational customer relationship together. Ideal profiles cannot be built from a single function’s perspective, since sales sees one side of the relationship, operations sees another, and finance sees a third.
Run the session on a fixed 60-minute agenda
Run this workshop in exactly 60 minutes so no single account eats the whole session. Time-box each account walkthrough to 5 to 7 minutes even if the room wants to keep talking.
- Minutes 0 to 10: Frame the session. Remind the room this is a narrative discussion; no single account is being judged.
- Minutes 10 to 45: Walk through each account using the five questions below, one account at a time.
- Minutes 45 to 55: Ask the group what showed up across more than one story.
- Minutes 55 to 60: Assign one owner to write up the synthesis within 48 hours.
Ask the same five questions for every account
Run this exact set of prompts for each relationship on your list:
- How did this relationship begin, and what problem were they solving at the time?
- What made momentum build quickly, or what slowed it down?
- What has kept the relationship intact over time?
- Where has friction shown up, if at all?
- How does this customer interact with your team today?
Use these three prompts when a leader doesn’t know an account’s history
Someone in the room will eventually say they don’t know how a relationship started. Redirect them toward what they’ve personally observed.
- “Have you personally interacted with this account?”
- “From what you’ve seen, what makes this relationship advantageous?”
- “What feels different about how this customer engages compared to others?”
Separate context from repeatable pattern
Test every answer against one question: could you design for this intentionally with a new account? “They were golfing buddies of the founder” is context you cannot replicate, while “they valued long-term partnership over the lowest price” is a pattern you can screen for.
| What leadership said | Classification | Why |
|---|---|---|
| “They were golfing buddies of the founder” | Context | Cannot be designed for with a new account |
| “They valued long-term partnership over the lowest price” | Pattern | Can be screened for on a discovery call |
| “They needed us the week their old supplier failed” | Outcome | Timing-driven, unlikely to repeat on command |
Defined Term: Repeatable pattern
A behavior or attribute in a customer relationship specific enough to design for deliberately in future accounts, because it shows up repeatedly across more than one generational customer.
Step 3: Build the four-part scoring rubric
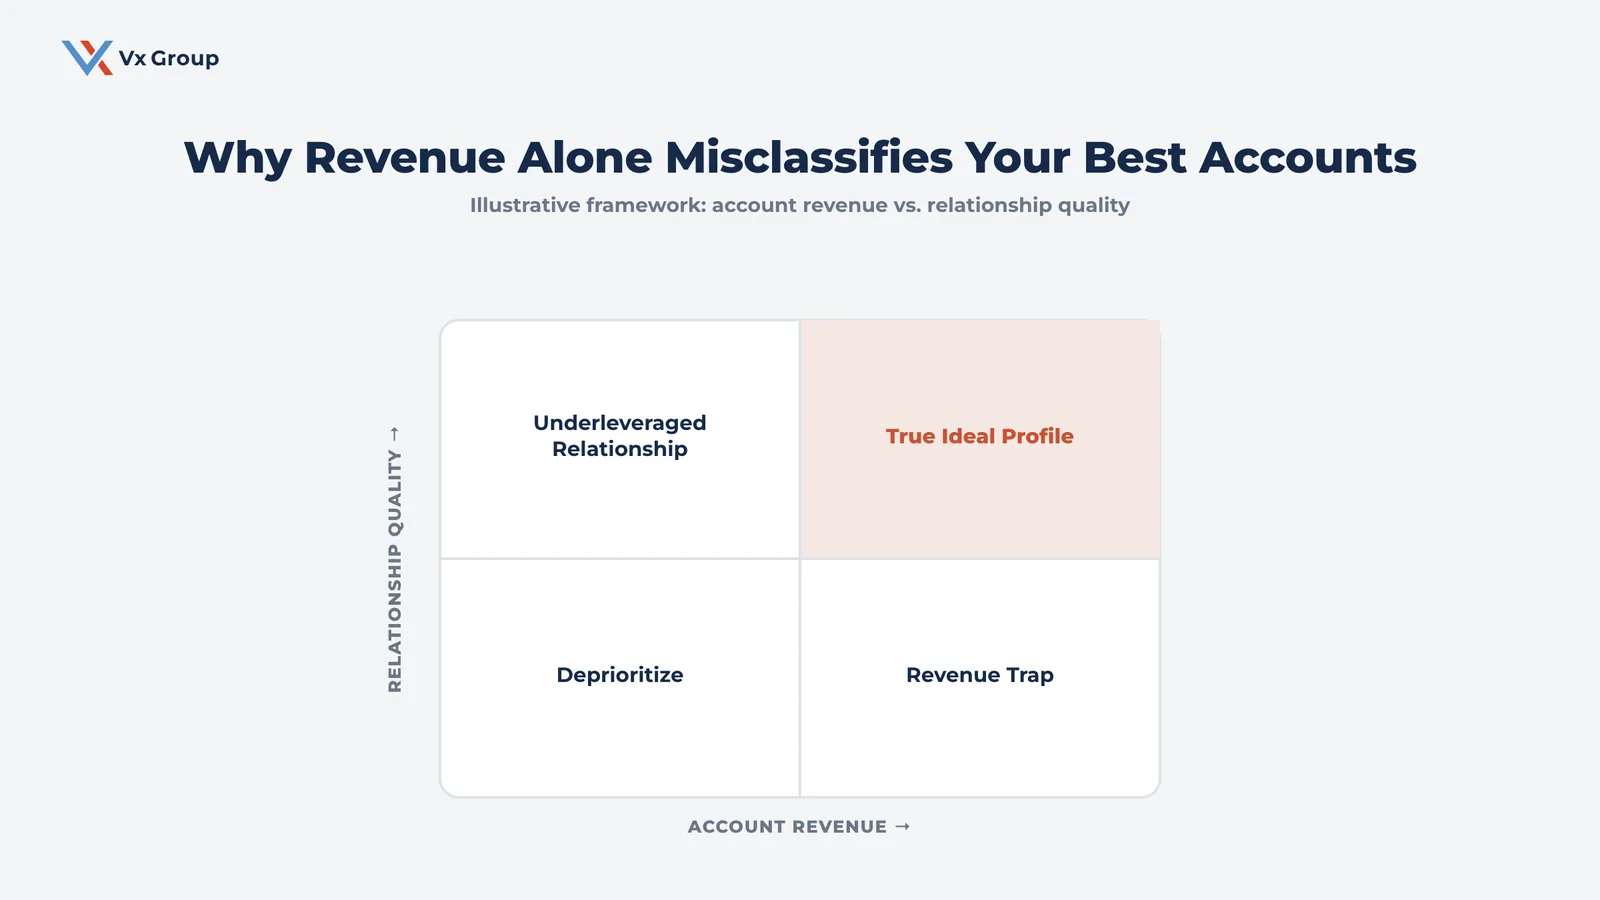
Score every account across four categories: relationship quality, expansion potential, strategic value, and firmographic fit. A template built only on revenue and headcount will rank your least loyal, highest-friction accounts right alongside your best relationships, because both can be large.
| Category | Weight | What it measures | 1-2 (weak fit) | 3 (moderate fit) | 4-5 (strong fit) |
|---|---|---|---|---|---|
| Relationship quality | 35% | Trust, tenure, and ease of collaboration | New, transactional, high friction | Stable, occasional friction | Long-tenured, low friction, high trust |
| Expansion potential | 25% | Room to grow wallet share or add product lines | Fully penetrated or shrinking | Some untapped need | Clear, named expansion opportunity |
| Strategic value | 25% | Referral activity, market credibility, or category influence | No referrals, no market signal | Occasional referral | Active referral source or named-account credibility |
| Firmographic fit | 15% | Revenue, headcount, industry, and geography | Outside your serviceable range | Adjacent to your range | Squarely inside your best-fit range |
These weights reflect how much each category predicts long-term relationship value. Relationship quality and expansion potential compound for years after the sale, while firmographic fit is simply a snapshot of what an account looked like on day one.
A $3 million account that has been with you for eleven years and sends two referrals a year might score 4.5 on relationship quality, 2 on expansion potential, and 5 on strategic value. A revenue-only screen would rank that account below a $15 million account that churns every renewal cycle.
Score using these specific, measurable indicators
Ground every score in something concrete the team can point to, like a specific escalation, a named referral, or a documented expansion conversation.
- Relationship quality: tenure in years as an active customer, number of escalations in the trailing 12 months, whether the primary contact has stayed in place through a leadership change, and response time on your last three account check-ins.
- Expansion potential: product lines they buy today compared to your full catalog, named and budgeted initiatives on their side that overlap with what you sell, and estimated wallet share within their total category spend, the core signal behind account expansion.
- Strategic value: warm introductions or referrals in the last 24 months, whether prospects or competitors reference this account by name, and whether the relationship gives you credibility in a specific vertical or region.
- Firmographic fit: revenue and headcount relative to your best-fit range, industry and geography match, and ownership structure such as family-owned, PE-backed, or public, if that has mattered historically.
Run the weighted-score formula
Multiply each category score, on a 1 to 5 scale, by its weight, then add the four results together.
Total score = (Relationship Quality x 0.35) + (Expansion Potential x 0.25) + (Strategic Value x 0.25) + (Firmographic Fit x 0.15)
A relationship-quality score of 4 at a 35% weight contributes 1.4 points to the account’s total. Run every account through the same formula so every score is comparable.
See the rubric scored against five sample accounts
| Account | Relationship quality (35%) | Expansion potential (25%) | Strategic value (25%) | Firmographic fit (15%) | Total score | Action |
|---|---|---|---|---|---|---|
| Account A | 5 | 2 | 4 | 3 | 3.70 | Strong fit, protect and expand |
| Account B | 2 | 4 | 2 | 5 | 2.95 | Deprioritize despite its size |
| Account C | 4 | 4 | 3 | 4 | 3.75 | Strong fit, pursue expansion actively |
| Account D | 3 | 3 | 3 | 3 | 3.00 | Moderate fit, monitor |
| Account E | 5 | 3 | 5 | 2 | 4.05 | True ideal profile |
Account B carries the highest firmographic score in the table and the lowest total. Its revenue size would have made it look ideal on a demographic-only template.
Account E’s total comes from this exact math: (5 x 0.35) + (3 x 0.25) + (5 x 0.25) + (2 x 0.15), which is 1.75 + 0.75 + 1.25 + 0.30, or 4.05. There is no hidden step and no special software required, so a marketing generalist can run every account in your book through this same formula this afternoon.
Set your four decision bands before you score a single account
Agree on these bands with leadership before scoring begins, so a borderline account doesn’t turn into a debate.
| Total score | Band | Action |
|---|---|---|
| 4.00 and above | True ideal profile | Pursue aggressively and use as a prospecting template |
| 3.50 to 3.99 | Strong fit | Protect the relationship and look for expansion |
| 3.00 to 3.49 | Moderate fit | Monitor, but don’t spend new business-development time here |
| Below 3.00 | Deprioritize | Stop investing incremental relationship time, even if revenue is large |
Step 4: Score your current book of business against the template
Run every active account through the same four-category rubric you just built. This step tells you whether the template actually separates your best relationships from the rest, before you use it to screen a new prospect.
Calibrate the scoring team before you run the full book
Before scoring all 40 or more accounts, have two or three leaders independently score the same 5 accounts and compare results. If any category differs by more than 1 point between scorers, discuss the specific evidence behind each number until the room agrees on what a 3 actually looks like versus a 4.
Build the scoring sheet with these exact columns
Set up one row per account with these columns: account name, relationship quality (1-5), expansion potential (1-5), strategic value (1-5), firmographic fit (1-5), weighted total, decision band, and account owner.
Write the weighted total as a formula referencing the four score columns, for example `=B2*0.35+C2*0.25+D2*0.25+E2*0.15` in Google Sheets or Excel. Add conditional formatting so each decision band gets its own color.
Flag your top and bottom deciles
Sort every account by total weighted score and pull out the top 10% and bottom 10%. The top decile should closely resemble your generational customers list from Step 1.
If it doesn’t, revisit the category weights before moving to Step 5.
Handle incomplete CRM data without stalling the exercise
Score every field you can verify and mark the rest “unscored” rather than guessing. Treat each unscored field as its own data-hygiene task for whoever owns the CRM, so the gap gets closed before the next quarterly review.
Check for the revenue trap
Look specifically for large accounts that score low on relationship quality and expansion potential. A firmographic-only template would flag these accounts as ideal simply because of their size.
A relationship-weighted template flags these as accounts worth protecting carefully, since the size that makes them attractive is also what drives customer concentration risk if the relationship weakens.
Run a leadership gut-check before you finalize the list
Pull the CEO and one other leader back in for 15 minutes once every account is scored. Ask directly whether anything on the ranked list surprises them, and why.
Step 5: Turn the template into a live filter for new business
Convert the scoring rubric into a one-page profile your sales and marketing team can use without you in the room. A framework that lives only in a workshop deck rarely gets used again.
Copy this one-page fillable profile
Ideal Customer Profile: One-Page Working Template
- Company name: ______
- Industry / vertical: ______
- Revenue range: ______
- Employee count: ______
- Relationship quality score (1-5): ______
- Expansion potential score (1-5): ______
- Strategic value score (1-5): ______
- Firmographic fit score (1-5): ______
- Weighted total score: ______
- Decision band: ______
- Relationship owner: ______
- Next review date: ______
Set a minimum score threshold for the pipeline
Decide on a total weighted score, for example 3.5 out of 5, below which a prospect does not enter active pursuit. This turns the template from a reflection exercise into a working filter your team applies every week.
Wire the threshold into your CRM
Create a custom property in HubSpot or Salesforce called something like ICP Score, built as four number fields (1-5) plus a calculated total, and require sales to log all four before an opportunity can advance past qualification. Add a workflow rule that automatically flags any opportunity below your threshold for a manager review instead of letting it move forward unchecked.
Route any account scoring below the threshold to a lighter-touch nurture track.
Train the sales team on how to use the rubric live on a call
During discovery, have the rep silently note gut-level 1 to 5 scores on the four categories without sharing the number with the prospect. Log the scores in the CRM within 24 hours of the call while the details are still fresh.
Set the review cadence and name an owner
Assign one owner, usually a marketing or growth leader, responsible for refreshing the generational customer list and re-scoring the book of business. Put a recurring 90-minute working session on the leadership calendar every two quarters to do it.
How do you use the finished template to find new, look-alike accounts?
Once your current book of business is scored, use the same four categories to screen net-new prospects, applying the same B2B prospecting strategies that already work for your best accounts, before they ever reach an opportunity stage in your CRM.
Build a firmographic search using your top decile as the model
Pull the firmographic profile of your 4.0-and-above accounts (industry, revenue range, employee count, geography) and build a saved search in ZoomInfo or LinkedIn Sales Navigator using those exact filters. This turns Step 3’s firmographic fit category into a live prospecting filter.
For example, if your top decile clusters between $2 million and $8 million in revenue with 40 to 150 employees in industrial manufacturing, build the saved search around those exact bounds rather than a broad, national manufacturing search.
Wait until after the first two touches to score relationship quality and expansion potential
A brand-new prospect has no tenure and no track record, so scoring relationship quality on day one is a guess. Wait until after two substantive touches, a discovery call and a proposal conversation, before assigning real scores to those two categories.
Use referral source as an early proxy for strategic value
If a new prospect came in through a referral from an existing 4.0-and-above account, start their strategic-value score at a 4 by default. A cold-sourced lead with no referral starts at a 2 until they prove otherwise on the call.
Route qualified look-alikes into the same CRM field from Step 5
Log the same four sub-scores on new prospects that you log on existing accounts, using the ICP Score property you built in Step 5. This keeps net-new pipeline and existing book of business measured on the identical scale.
What mistakes should you avoid when scoring an ideal customer profile template?
- Scoring accounts alone. One leader’s view of any relationship is partial, since sales, finance, and delivery each see a different side of the same account.
- Skipping the firmographic baseline. Without it, you lose the ability to spot true look-alike accounts when you screen new prospects later.
- Letting the workshop turn into a debate about one specific deal. Redirect the room back to what repeats across multiple accounts.
- Weighting firmographics the heaviest because it feels the most objective. Firmographic data is simply the easiest of the four categories to gather. Predictive power sits with relationship quality and expansion potential.
- Scoring the template once and filing it away. A rubric that isn’t revisited every two quarters drifts out of sync with the accounts actually driving growth.
- Leaving every score unowned. Assign a named account owner to each score, or accountability for keeping it current disappears.
- Setting the pipeline threshold low enough that everyone clears it. A threshold everyone can clear isn’t a filter.
- Treating the one-page profile as a filed-away document. Put it in front of sales on every discovery call.
- Copying a generic template from a search result. A demographic checklist built for a SaaS company won’t reflect how a 12-month sales cycle or a multi-generational customer relationship actually compounds value.
Most leadership teams can build this rubric in a single workshop session. Revisit the weighting every two quarters as your generational customer list changes, so the template keeps matching the relationships actually driving growth.
Ready to grow?
Get help building and scoring your ideal customer profile template with your leadership team.
FAQs
About the Author: Jacob Camhi
