

How to Measure Trade Show ROI
Trade show ROI is the total revenue and relationship value a show generates, divided by its fully loaded cost. Most exhibitors understate it badly, because they stop counting at leads scanned. Few of them track what those leads turn into six or twelve months later, which is where the real return usually shows up.
TL;DR
- Trade show ROI only holds up if you calculate the fully loaded cost first: booth, travel, staff time, and the opportunity cost of pulling people off other work.
- Define what a win looks like before the show, tied to named target accounts and a revenue goal.
- Build an attribution window of 6 to 18 months, because relationship-driven deals rarely close in the same quarter as the show.
- Track relationship progress (target-account meetings, decision-makers met, lapsed customers re-engaged) as its own metric.
- Run the math with a simple formula: (attributed revenue plus relationship value created, minus fully loaded cost) divided by fully loaded cost.
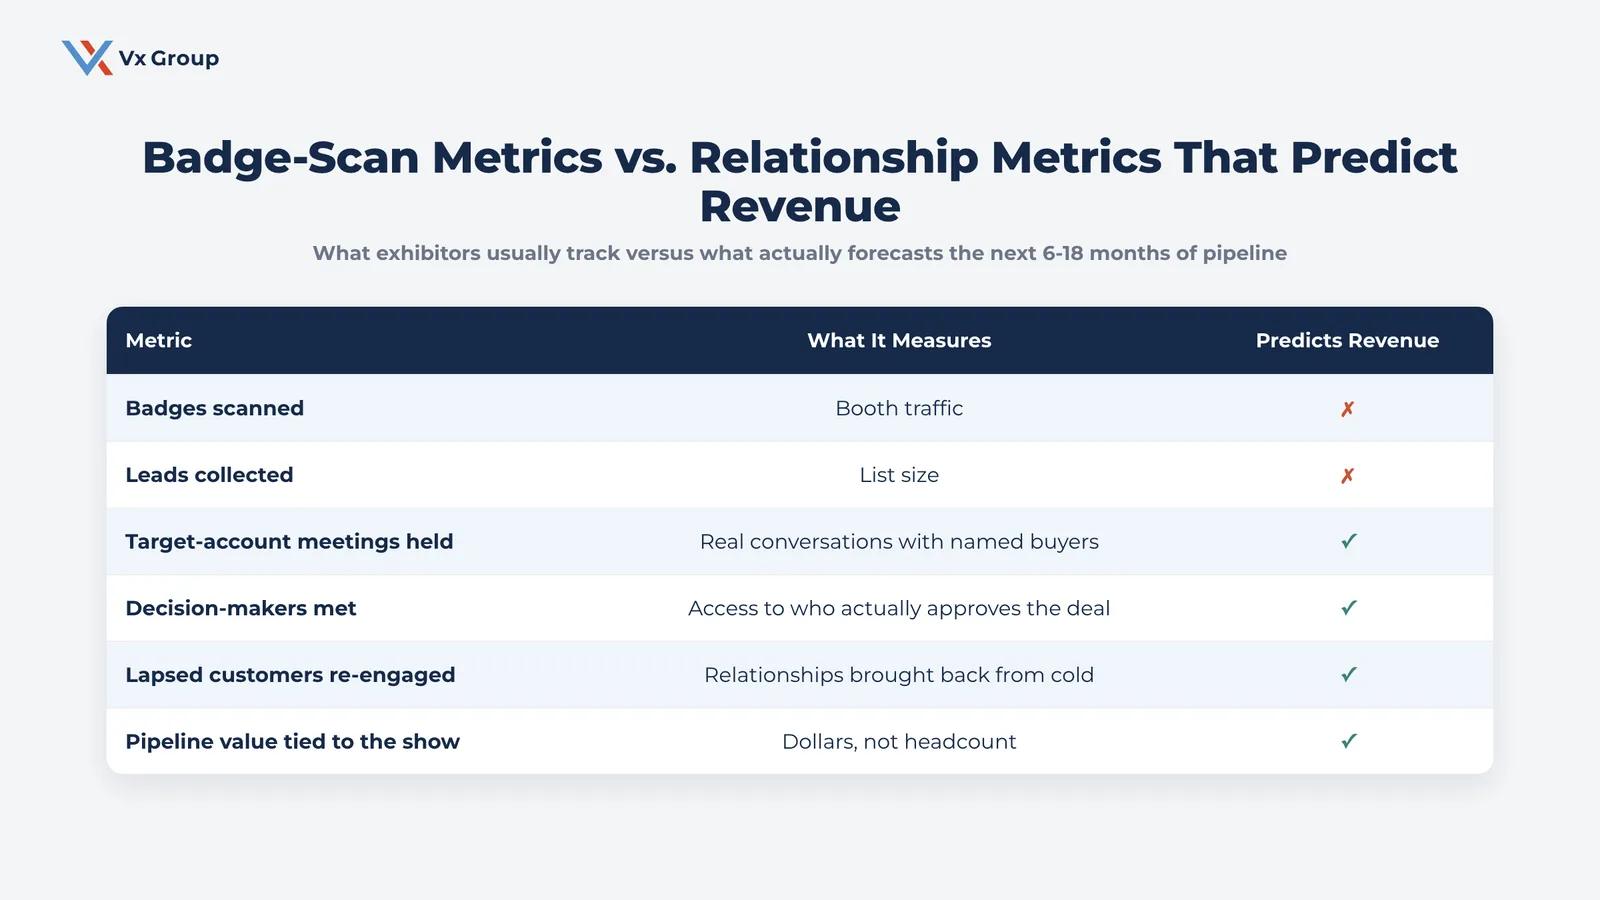
Most exhibitors measure a trade show with a scoreboard built for a different game. Badges scanned. Leads collected. Booth traffic. That scoreboard rewards volume, and it tells you almost nothing about whether the show built a single relationship worth pursuing.
The badge-scan scoreboard survives because it is easy to report. A number on a lanyard scanner looks like proof of a good show, even when three of those “leads” were college students collecting stress balls and forty more were vendors working the floor themselves. It also survives because nobody owns the harder job of tracking a contact for eighteen months after the show ends, so the easy number is the only one that ever makes it into the debrief.
Finance and leadership eventually notice the pattern: a show gets reported as a success every year, and the pipeline it supposedly generated never quite shows up in the numbers. Nobody built a way to measure the show on the timeline its relationships actually move on, and the show quietly takes the blame for that missing measurement.
That distinction matters more in account-based selling than in high-volume transactional sales. A relationship-driven B2B company sends five people to a show to have twelve real conversations with named buyers. Three hundred business cards collected from strangers walking the floor do not count toward that goal, no matter how good the number looks on a post-show slide.
The five steps below build a way to measure the show that actually reflects what it was for.
1. Calculate the fully loaded cost of your show
Most exhibitors calculate cost by looking at one invoice: the booth and floor space. That invoice is real, but it usually accounts for less than half of what the show actually cost.
Defined Term: Fully loaded cost.
The total cost of exhibiting at a trade show: booth and space, travel and lodging, staff time valued at what those people would otherwise be doing, shipping and production, and follow-up work after the show ends.
Most exhibitors track only the line items that show up on the venue’s invoice, which is a fraction of this total.
Add up the direct show costs
Start with the costs that show up on an invoice somewhere. List every one of the following as its own dollar figure:
- Booth rental or exhibit space fee
- Booth design, build, and refurbishment
- Shipping crates and materials to and from the venue
- Signage, printed collateral, and giveaways
- Sponsorship, speaking, or event-listing fees
Write down the actual amount for each line so the total holds up when someone questions it later. A rough guess will not survive that conversation.
Cost out your team’s time
Every person you send to a show is not doing their regular job for however many days the trip takes, including travel. Take each person’s fully loaded salary (base pay plus benefits, divided by working days in the year) and multiply it by the number of days they are out of the office. A $95,000-a-year sales director costs roughly $475 a working day; four days at a show costs the company about $1,900 in that person’s time alone, before travel and lodging.
Repeat the calculation for every person on the trip and add the totals together.
Price the opportunity cost of the trip
Staff time covers the salary. Opportunity cost covers what those same people would have produced if they had stayed home. If your best account manager spends four days at a show instead of running the account reviews already on the calendar, that is a real cost, even though no invoice captures it. Estimate it conservatively: one missed renewal conversation, one delayed proposal, one account check-in that slips a month.
Total it into one fully loaded number
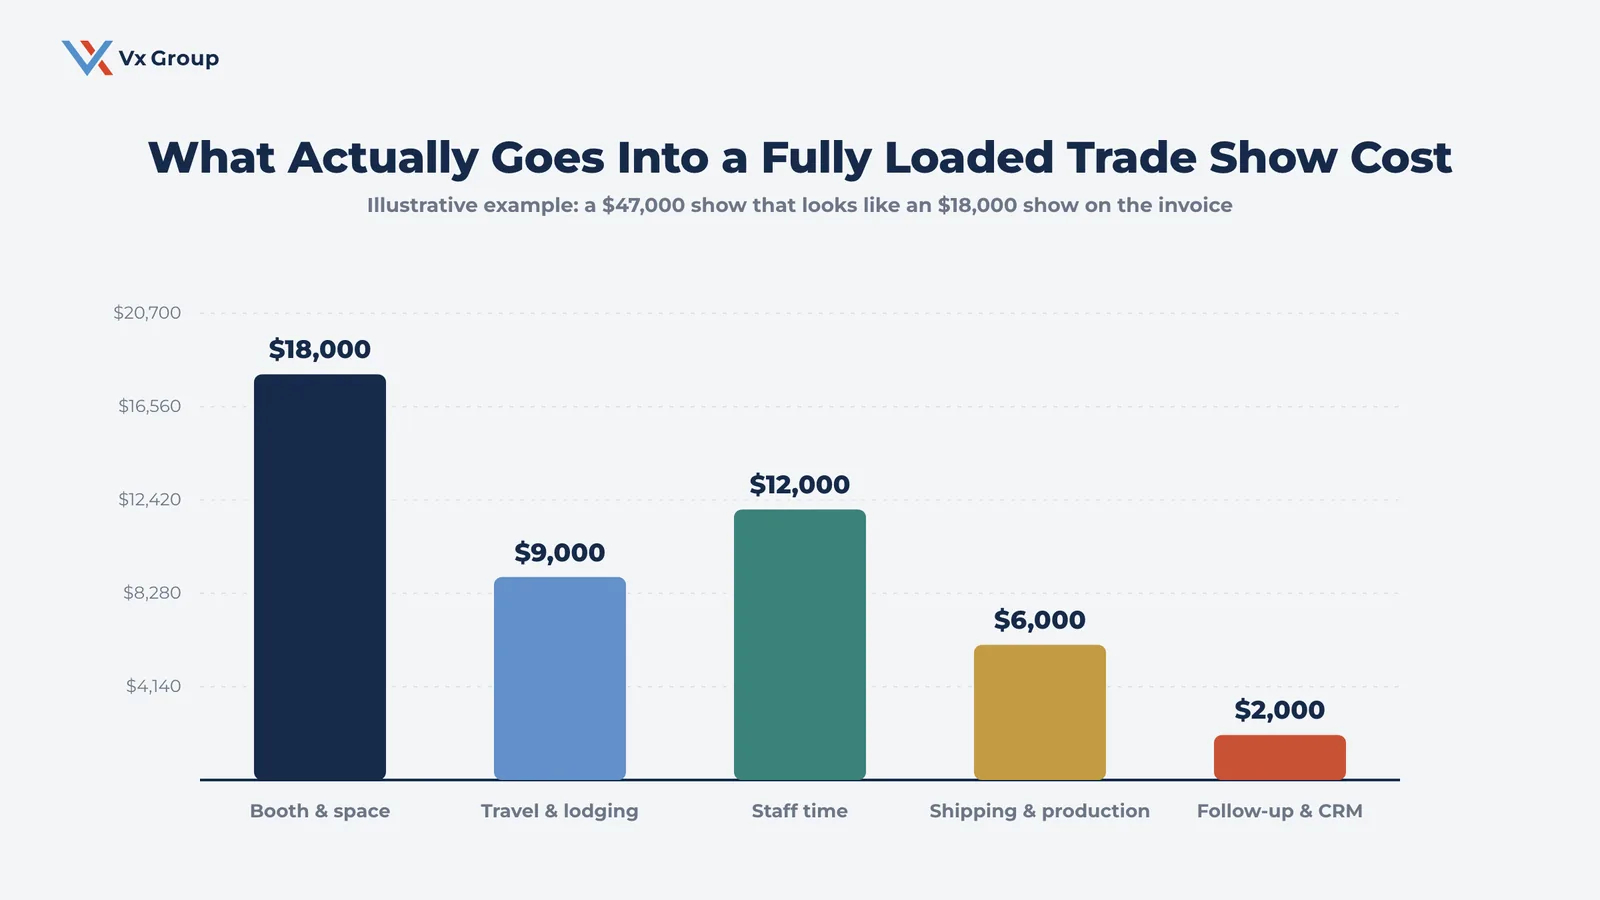
Add the direct costs, the staff-time costs, and the opportunity cost into a single number. That number is the denominator for every ROI calculation you run on this show. The booth invoice alone will produce a figure that looks better than reality and will not hold up under scrutiny. A $18,000 booth fee routinely becomes a $45,000 to $50,000 fully loaded cost once travel, staff time, and follow-up are counted honestly.
2. Define what a win looks like before the show
A show without a defined win set in advance gets judged after the fact by whoever is loudest about how it went. That kind of after-the-fact judgment is impossible for anyone else to check or repeat next year.
Build your target-account list before the show
Pull the list of accounts you actually want to see at the show: current customers worth expanding, top accounts whose renewal or expansion matters most this year, and prospects that match your real target profile. Skip the temptation to add every company that simply registered for the show; the list should stay short enough that every name on it gets real preparation.
Assign a name to each account: the specific person your team is trying to see, and who on your team is responsible for seeing them. A relationship-first prospecting approach applied to a show floor looks the same as it does anywhere else: fewer names, more preparation, a real reason to talk to each one.
Set a revenue goal tied to those accounts
Attach a number to the list. If the target-account list includes eight expansion accounts averaging $40,000 in additional annual revenue and five new-target accounts at an average deal size of $85,000, the show has a real revenue goal before a single conversation happens.
That goal becomes the number you compare actual results against later. It replaces the old habit of comparing this year’s lead count to last year’s lead count, which measures activity and says nothing about revenue.
Write down the win criteria in one line
Before the show, write one sentence that defines success: for example, “meet with six of the eight expansion accounts and open two of the five new-target accounts.” Share that sentence with everyone going. Each person at the booth should be able to say, in one sentence, what a good show looks like for them specifically.
Ready to grow?
If you want help building an attribution model that actually credits your trade shows for the deals they source.
3. Build an attribution model that credits long sales cycles
A show that produces a $310,000 deal ten months later looks, on a same-quarter report, like a show that produced nothing. That gap is exactly where most trade show ROI dies on paper. The deal is real; the report simply never lived long enough to catch it.
Log every show-sourced contact in the pipeline the day you get home
Every real conversation from the show gets a record in the CRM within 48 hours, tagged with the show it came from, tied to a named account, and assigned an owner. This is the single most common failure point: contacts sit in a spreadsheet or a stack of business cards for three weeks and quietly disappear before anyone logs them.
Set a 6 to 18 month attribution window
Relationship-driven B2B deals rarely close in the same quarter they start. Set the attribution window for the show at 6 to 18 months, matching the typical stages of your sales cycle, and revisit the show’s ROI at that horizon. A report pulled the week after the show will almost always understate what it actually produced, because most of the deals it sourced are still sitting in early conversations.
Put the exact date on the calendar when you plan to re-pull the numbers, whether that is 6, 12, or 18 months out, so the second look actually happens instead of getting lost in the next show’s planning cycle.
Tag deals by source so the show gets credit later
Tag every opportunity that touches a show-sourced contact with the show’s name in your CRM, even if the deal takes eight more touches and eleven months to close. When finance or leadership asks what the show produced, the honest answer requires pipeline management built to hold that history. A manager’s memory of who they talked to in the booth will not hold up six months later, and it certainly will not hold up at renewal-budget time next year.
4. Track relationship progress as a first-class outcome
Relationship progress is the leading indicator that predicts whether a show pays off. Most exhibitors never measure it, because it does not fit neatly into a spreadsheet column the way a lead count does.
Count target-account meetings held
For each name on your target-account list, log whether the meeting happened, who attended from both sides, and what was agreed to next. A show where six of eight target accounts sat down for a real conversation outperformed a show with four hundred badge scans and zero named meetings, even though the second show’s lead report looks bigger on a slide.
Track lapsed customers you re-engaged
A trade show is one of the few settings where a customer who went quiet will sit down with you again in person. Log every lapsed or at-risk account someone on your team spoke with, and treat a re-engaged lapsed account as a measurable win on its own, separate from new pipeline.
Log decision-makers met
Track the actual title and buying authority of each person your team met at the show. A stack of business cards from whoever staffed a competitor’s booth means little if none of those names can actually approve a deal. Weight the show’s success by how many real decision-makers your team got in front of, since that number is what actually correlates with a closed deal down the line.
Keep a simple tracking sheet at the booth
A single running sheet, updated after every meaningful conversation, is enough to capture all of this without extra software:
- Account name and whether it was on the target list
- Meeting held (yes or no) and who attended
- Decision-maker present (yes or no)
- Next step and who owns it
For a fuller framework on separating these signals from booth traffic, see how to measure trade show effectiveness, which walks through the relationship-quality lens in more depth.
5. Run the post-show math
Once the fully loaded cost, the target-account results, and the attributed pipeline are all logged, the ROI calculation itself takes five minutes.
Trade Show ROI formula:
ROI = (Attributed Revenue + Relationship Value Created − Fully Loaded Cost) ÷ Fully Loaded Cost × 100
Plug your numbers into the ROI formula
Attributed revenue is every closed deal your CRM ties back to the show within the attribution window. Relationship value created covers the harder-to-price wins: a lapsed account fully re-engaged, a stalled deal that moved forward because you met in person, a referral that came out of a booth conversation. Where you cannot assign a precise dollar figure to relationship value, flag it as directional. Do not invent a precise number just to fill the gap.
Walk through a worked example
A company sends five people to a regional show. The fully loaded cost, following Step 1, comes to $47,000: $18,000 booth and space, $9,000 travel and lodging, $12,000 in staff time, $6,000 in shipping and production, and $2,000 in follow-up work.
| Cost category | Amount |
|---|---|
| Booth & space | $18,000 |
| Travel & lodging | $9,000 |
| Staff time (opportunity cost included) | $12,000 |
| Shipping & production | $6,000 |
| Follow-up & CRM logging | $2,000 |
| Fully loaded cost | $47,000 |
Over the following 18 months, the CRM shows three deals tagged to the show closing for a combined $210,000, plus one re-engaged lapsed account the team values conservatively at an additional $25,000 based on its prior order history.
ROI = ($210,000 + $25,000 − $47,000) ÷ $47,000 × 100 = 400%
On the same-quarter view, that show looked like a $47,000 expense with no return. Measured honestly, with the fully loaded cost and the relationship value counted on the timeline the deals actually closed, it returned four dollars for every dollar spent.
Decide whether to go back next year
Compare the actual ROI against the win criteria you wrote down in Step 2. A simple decision rule keeps the call consistent from year to year:
- If ROI clears your target and the target-account meetings happened, keep the show at the same budget or scale it up.
- If ROI is positive but the target-account meetings fell short, keep the show but shrink the footprint and tighten the pre-show outreach.
- If ROI is negative and the target accounts never showed up, cut the show and redirect the fully loaded cost toward accounts you can reach a different way.
The fully loaded cost number tells you exactly what it would take to justify going back next year, which is a far more useful figure than a general sense that the booth felt busy.
Run this math after every show on the calendar, including the smaller regional ones. A quarterly regional show with a $12,000 fully loaded cost and a tight target-account list can post a higher ROI than the flagship event everyone remembers, once both are measured the same way.
Write the ROI, the win-criteria result, and the go/no-go decision into the same place you keep the show’s budget request for next year. When the renewal conversation comes up in twelve months, whoever owns that budget line should be able to point to a number instead of relying on how the show felt at the time.
FAQs
About the Author: Jacob Camhi
