

The Leading Indicators That Predict B2B Revenue

Business leading indicators are numbers that move before revenue does, so a leadership team can act while the outcome can still change. In a relationship-driven B2B company, the most useful ones track relationships: top accounts with a documented next step, new conversations inside existing customers, proposal velocity, and pipeline from people who already trust you.
TL;DR
- Revenue, gross margin, and profit are lagging indicators. They report on decisions and conversations from two or three quarters ago.
- A leading indicator moves first, and your team can change it this week.
- In a relationship-driven B2B company, the numbers that move first are relationship numbers: documented next steps in top accounts, new conversations inside existing customers, proposal velocity, and the share of pipeline from people who already trust you.
- Track four to six, write a one-line definition for each, give each one an owner, and review them on a fixed schedule.
- Pair every leading indicator with the lagging number it should predict, and check once a quarter whether it did.
Most owners read the monthly P&L carefully. It’s the most accurate report in the building. It’s also a report on decisions the company made six to nine months ago.
In a business with a long sales cycle, that gap is the whole problem. The order that shipped in March started with a conversation the previous summer, became a quote in the fall, and cleared the customer’s capital approval in January. By the time it shows up as revenue, there’s nothing left to manage. The same is true of the orders that never came in.
So the owner looks at a number nobody can change anymore and asks the sales team to push harder. The team makes more calls, activity goes up, and revenue lands where it was going to land anyway.
We call this the activity illusion: measuring how busy the team is and treating it as a forecast. It’s an understandable habit, because activity is easy to count and it feels like control.
Leading indicators fix the timing problem. The useful ones in a relationship-driven company measure whether relationships are moving forward, and every one of them can be pulled from a CRM and an order history you already have.
What are business leading indicators?
Business leading indicators are measures that change before the result you care about changes, which gives you time to act on them. Revenue is the result. The leading indicators are the earlier steps that reliably come before it: conversations, next steps, proposals, and requests for quote.
Defined Term: Leading indicator.
A measure that moves ahead of a business result and that the team can influence in the current week or month, such as the number of top accounts with a documented next step or the number of proposals sent.
Economists have worked this way for decades. The Conference Board’s Leading Economic Index, for example, has long included manufacturers’ new orders and the average weekly hours worked in manufacturing, because orders and hours tend to move before output and employment do. The index is imperfect, and economists watch it anyway because it moves first.
A company can do the same thing with its own numbers. Your version of “new orders” sits upstream of your orders: the conversations, visits, and quotes that turn into purchase orders a quarter or two later.
Two tests tell you whether a number is a real leading indicator:
- It moves before the result. When it rises or falls, revenue follows on a delay you can roughly predict.
- Your team can change it this week. If nobody can act on the number until next quarter, it’s a report, and the P&L already gives you plenty of those.
Activity counts usually fail the first test. Calls made and emails sent rise and fall with effort, and effort on its own has a loose connection to revenue in a business where customers buy every few years and decide by committee. Our growth framework piece covers why the measurement has to match how the company actually grows.
What is the difference between leading and lagging indicators?
A leading indicator moves before a business result and can be changed this week. A lagging indicator reports a result after it has happened, which makes it accurate and hard to act on. Revenue, margin, profit, and retention are lagging. Next steps, new conversations, proposals, and quote requests are leading.
Defined Term: Lagging indicator.
A measure that confirms a business result after the fact, such as revenue, gross margin, net profit, or customer retention. It is the most accurate scorecard a company has and the one it can do the least about in the current quarter.
A leadership team needs both kinds. Lagging indicators confirm whether last year’s plan paid off, and leading indicators show whether this quarter’s work is on track. The table below sorts the numbers most owner-led B2B companies already have, along with what each one lets you do.
| Indicator | Type | What it tells you | What it lets you do |
|---|---|---|---|
| Revenue | Lagging | What customers bought last month or last quarter | Confirm whether the plan worked |
| Gross margin | Lagging | How profitable that revenue was | Adjust pricing and product mix for next year |
| Net profit | Lagging | What the business kept | Report to owners, lenders, and the board |
| Net revenue retention | Lagging | Whether the existing customer base grew or shrank over 12 months | Find the accounts that shrank, after the fact |
| Top accounts with a documented next step | Leading | Whether your most important relationships are moving | Call the accounts with no next step this week |
| New conversations inside existing customers | Leading | Whether relationships are widening beyond one contact | Ask for introductions to new people at current accounts |
| Proposal velocity | Leading | How much new business is being shaped right now | Move stalled conversations toward a proposal or close them out |
| Share of pipeline from people who already trust you | Leading | Whether new business is coming through relationships or through cold volume | Ask for referrals and introductions on purpose |
| Top accounts overdue on their order rhythm | Leading | Which important accounts have gone quiet | Call before a quiet account becomes a lost one |
Net revenue retention is worth a note. It’s one of the best lagging numbers a relationship-driven company can track, and we wrote a full guide to net revenue retention for companies without subscriptions. It still looks back twelve months, which is why the leading indicators below exist.
Are corporate profits a leading or lagging indicator?
Corporate profits are a lagging indicator. Companies report profits after a quarter closes, so the number confirms what already happened in the economy or the business. Economists use aggregate profits to confirm a trend that earlier measures, such as new orders, signaled months before.
The same logic holds inside a single company. Your own profit is the last number to move. It reflects pricing, mix, and volume decisions that were set in motion long before the quarter it reports, which makes it the right number for judging a year and a poor one for steering a week.
When profit falls, look upstream. In the companies we work with, the first number to slip is usually one of the relationship indicators below, a quarter or two before the margin did.
Why does revenue lag so far behind activity in B2B?
Revenue lags in B2B because the buying process is long and involves several people. Between a first conversation and an invoice, a typical relationship-driven sale goes through a site visit, a request for quote, a proposal, approvals on the customer’s side, a purchase order, production or delivery, and billing. In a business with a six- to nine-month sales cycle, this quarter’s revenue was mostly decided two or three quarters ago.
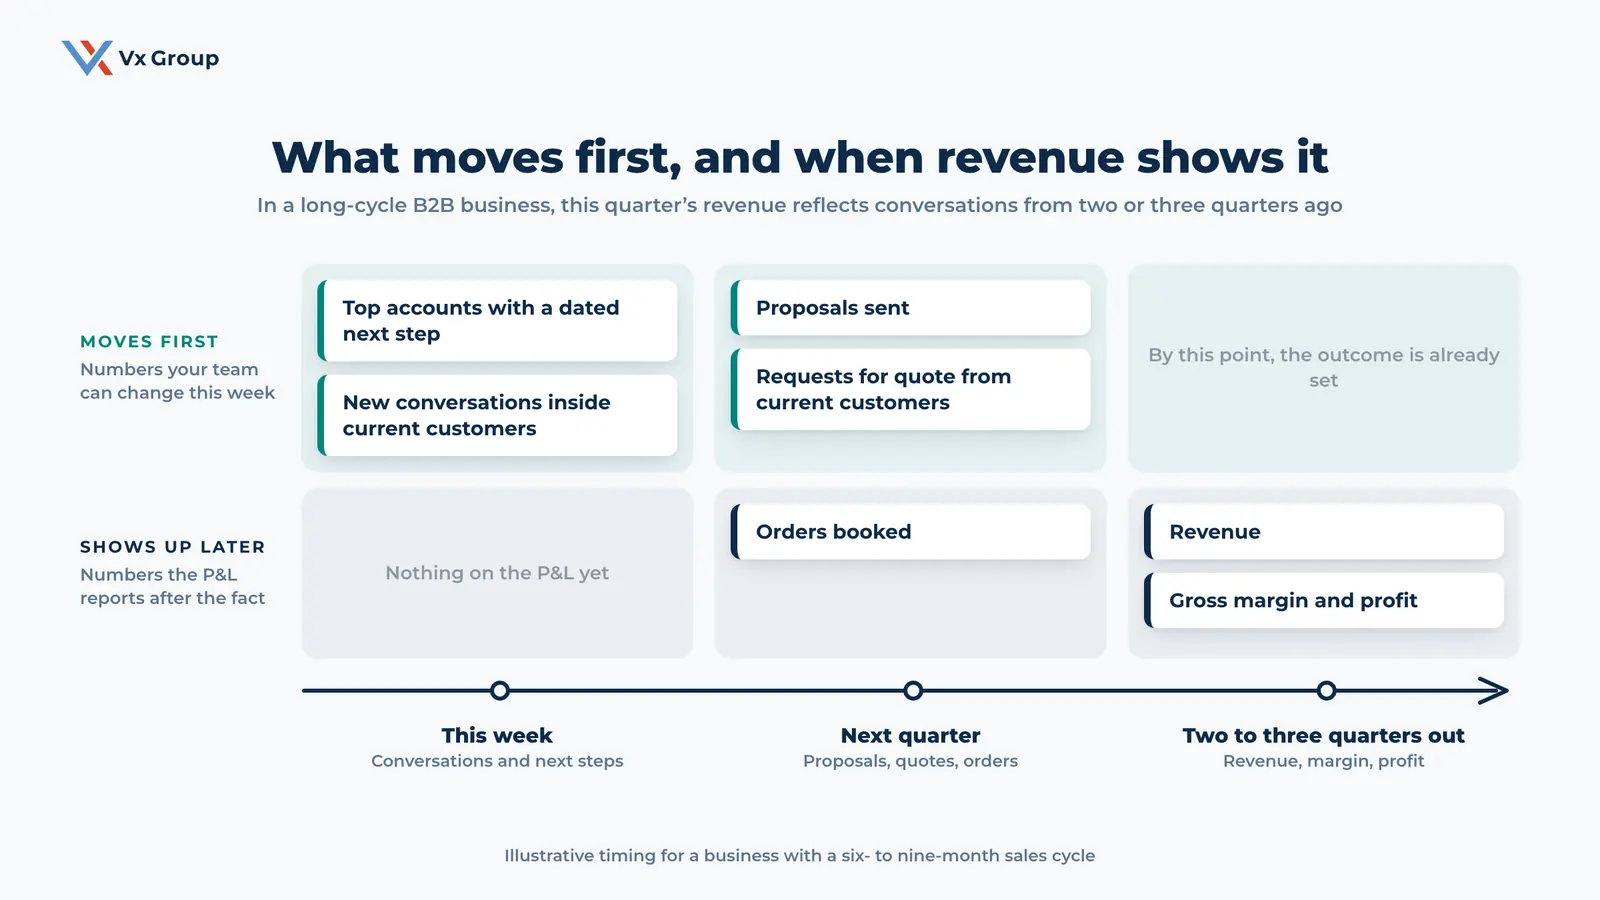
That delay is why a strong quarter can hide a thinning pipeline, and a slow quarter can follow a year of good work. Owners who manage from the P&L alone tend to react in the wrong direction at the wrong time. They cut marketing after a soft quarter that was already turning around, or they relax after a strong one built on conversations nobody is having anymore.
The fix is a short set of numbers that sit upstream of revenue and get reviewed often enough to act on. The most common wrong response to a slow quarter is asking for more leads, and we covered why in Why “More Leads” Is Almost Never the Answer.
Field Notes:
A pattern we see in owner-led companies after a record year: revenue is up, the team is stretched serving existing orders, and nobody has time for new conversations. Next steps in the top accounts quietly lapse. Proposal volume falls off in the spring. The P&L looks fine through the summer, because it is still reporting on last year’s conversations. By fall the gap is visible, and closing it takes another two or three quarters. The numbers that would have warned them were sitting in the CRM in March.
Ready to grow?
We help owner-led B2B companies choose the handful of numbers that move before revenue, define them, and build a review the leadership team actually runs.
Which leading indicators predict B2B revenue?
Seven leading indicators predict revenue in most relationship-driven B2B companies. Each one tracks a relationship moving forward, and each can be pulled from a CRM and order history you already have:
- Top accounts with a documented next step
- New conversations inside existing customers
- Proposal velocity
- Share of pipeline from people who already trust you
- Top accounts overdue on their order rhythm
- Relationship coverage in top accounts
- Requests for quote from current customers
1. Count top accounts with a documented next step
Take your top 20 accounts by revenue over the last twelve months. Count how many have a specific next step in the CRM with a date on it: a visit, a call, a sample, a proposal review. Divide by 20.
This is the most useful early warning in a relationship-driven business. An account without a next step can keep ordering for months. Nobody is moving it forward, though, and accounts that nobody moves tend to drift.
- How to measure it: top 20 accounts with a dated next action, divided by 20.
- How often to review it: weekly.
- What it predicts: retention and expansion revenue in those accounts two to three quarters out.
- What to do when it drops: each account owner books a next step with every account missing one before the following weekly meeting.
2. Track new conversations inside existing customers
Count first real conversations with someone you haven’t talked to before at a company that already buys from you: a new engineer, a second plant, a purchasing lead, an executive. A relationship that runs through one contact is fragile, and new contacts inside current customers are often where the next order comes from.
- How to measure it: first conversations with new people at existing customers, per month, by account owner.
- How often to review it: weekly for the count, monthly for the trend.
- What it predicts: expansion revenue, and retention when a contact leaves.
- What to do when it drops: ask each account owner to request one introduction at each top account this month.
3. Measure proposal velocity
Proposal velocity has two parts: how many proposals went out this month, and the average number of days from the first real conversation to a proposal. More proposals going out faster usually means more revenue two quarters later. Fewer proposals, or slower ones, show up in revenue on the same delay.
- How to measure it: proposals sent per month, by count and dollar value, plus average days from first conversation to proposal.
- How often to review it: monthly.
- What it predicts: new revenue in one to three quarters.
- What to do when it drops: review every open conversation older than your normal time to proposal, and decide whether it moves forward this month or comes off the list.
4. Watch the share of pipeline from people who already trust you
Of the new pipeline created this month, measure the share that came from a referral, an existing customer, a distributor or partner introduction, or a former contact who moved to a new company. In our experience these opportunities close more often and with less pressure on price than cold ones, which is why the mix matters as much as the total. Our piece on your top ten customers as a growth strategy covers where most of those introductions come from.
- How to measure it: new pipeline dollars from trusted sources, divided by all new pipeline dollars.
- How often to review it: monthly.
- What it predicts: win rate and margin on next year’s new business.
- What to do when it drops: make introduction requests a standing item in every top-account conversation.
5. Flag top accounts that fall behind their normal order rhythm
Most repeat customers order on a rhythm. If an account that normally orders every 30 days hasn’t ordered in seven weeks, that’s worth a phone call this week, months before it shows up as a decline in annual revenue.
- How to measure it: the number of top accounts more than 50% past their normal reorder interval, pulled from order history.
- How often to review it: weekly.
- What it predicts: shrinking orders and lost accounts.
- What to do when it fires: the account owner calls within the week to find out what changed. Our guide to customer retention strategies covers what to do with the answer.
6. Measure relationship coverage in your top accounts
Count how many people you know by name at each top account, and track the share of top accounts where you know three or more. When a buyer retires or a competitor shows up, coverage decides whether you hear about it early or find out from a declining order report. The quarterly business review with your largest customers is one of the best places to meet the second and third person at an account.
- How to measure it: the share of top accounts with three or more named contacts who have spoken with your team in the last six months.
- How often to review it: monthly.
- What it predicts: retention through buyer changes and competitive pressure.
- What to do when it drops: the senior leader assigned to each low-coverage account sets up a meeting one level above the current contact.
7. Count requests for quote from current customers
A request for quote from an existing customer means they plan to buy something and they thought of you. A drop in quote requests from current customers often comes before a drop in orders. An RFQ you hear about after the fact, from a customer who sent it to other suppliers, is a warning in its own right.
- How to measure it: requests for quote received from existing customers per month, by account.
- How often to review it: monthly.
- What it predicts: orders in the next one to two quarters.
- What to do when it drops: ask your top accounts directly what projects they have coming in the next two quarters.
How many leading indicators should a business track?
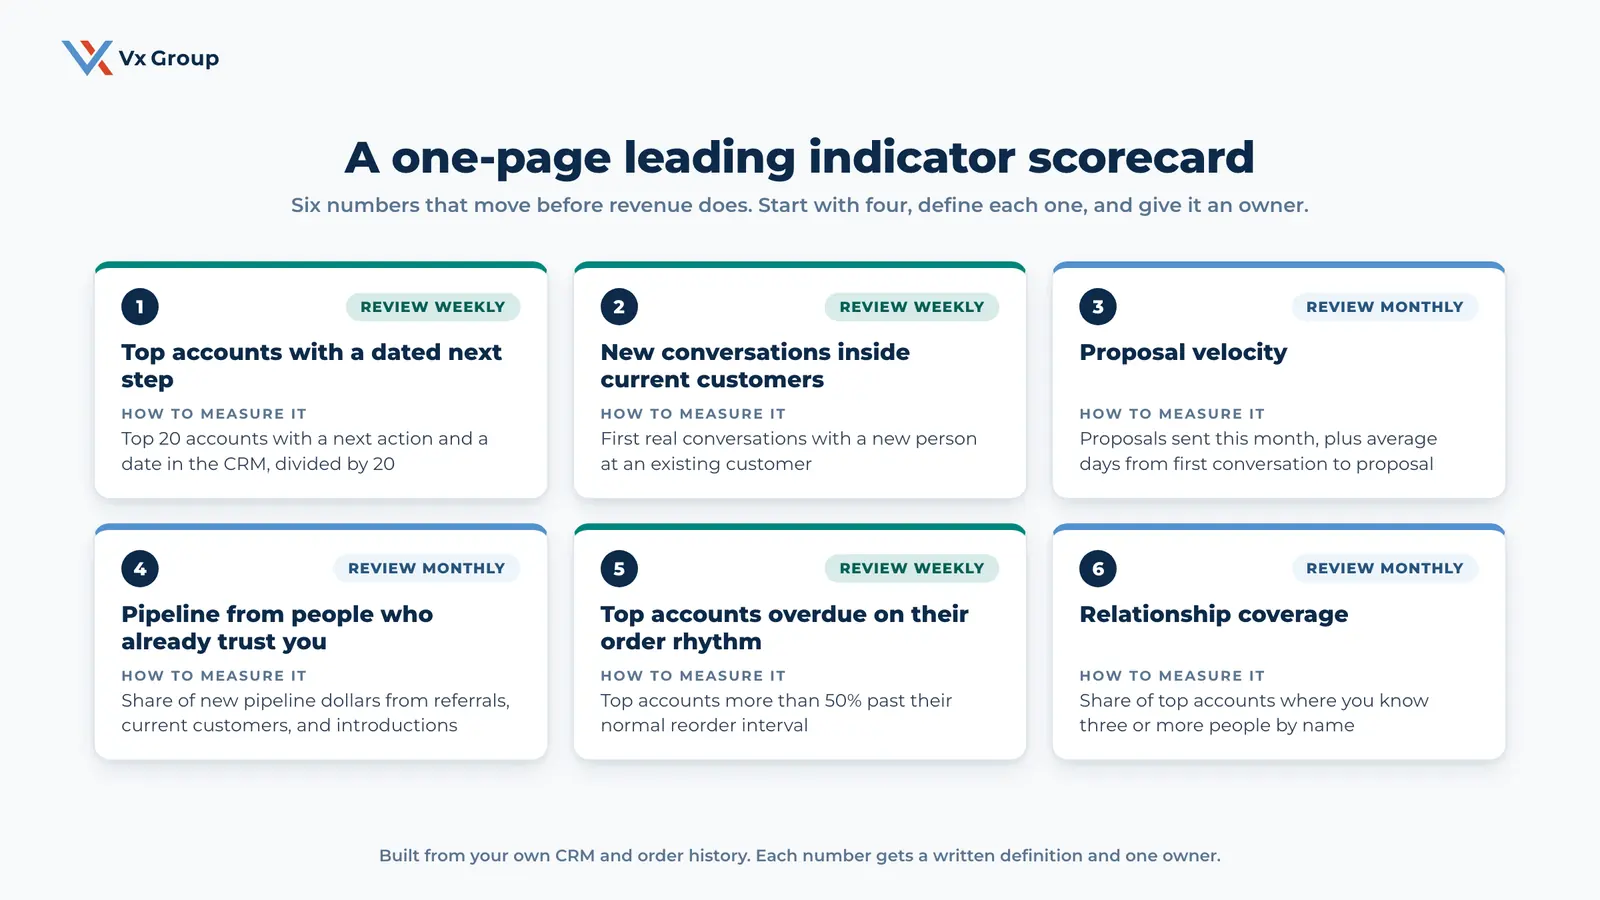
Track four to six leading indicators. Fewer than four leaves blind spots, and more than six turns the review into a reporting exercise. A relationship-driven company starting from scratch should begin with the first four on the list above, then add order rhythm and relationship coverage once the first four are reported reliably.
Four rules help decide which ones make the cut:
- Every indicator needs an owner who can change it.
- Every indicator needs a one-line definition, so it means the same thing every month.
- Every indicator should pair with a lagging number it is supposed to predict.
- If a number hasn’t changed a decision in two quarters, drop it.
How do you build a leading indicator scorecard?
Build the scorecard as one page: four to six numbers, a written definition for each, one owner each, the lagging number each one should predict, and a review schedule. It belongs in the leadership meeting, where the people who can act on the numbers are already in the room.
Write a one-line definition for each number
A good definition removes any room for interpretation. For example: “Top accounts with a next step: of our top 20 accounts by trailing twelve-month revenue, the number with a dated next action in the CRM as of Monday at 9 a.m.” Without a definition, the number drifts every time a different person reports it.
Name one owner for each number
The owner reports the number and explains why it moved. In most owner-led companies the head of sales owns the account numbers, and the owner or president owns the pipeline mix. One name per number, written on the scorecard.
Pair each indicator with the lagging number it should predict
Write the pairing next to each indicator so the team knows what it is betting on:
| Leading indicator | Lagging number it should predict |
|---|---|
| Top accounts with a documented next step | Retention and expansion revenue in the top 20 accounts |
| New conversations inside existing customers | Expansion revenue from existing customers |
| Proposal velocity | New revenue in one to three quarters |
| Share of pipeline from people who already trust you | Win rate and margin on new business |
| Top accounts overdue on their order rhythm | Shrinking orders and lost accounts |
| Relationship coverage in top accounts | Retention when a buyer changes |
Review weekly in 15 minutes and monthly in an hour
Each week, spend the first 15 minutes of the leadership meeting on the fast numbers: next steps, new conversations, and overdue accounts. Agree on one action for any number that’s off. Each month, review the full set with trends for an hour, alongside the P&L.
If you already run a business growth operating system, these become the scorecard numbers in your weekly meeting. If you don’t, this review is a reasonable place to start one.
Check every quarter whether the indicators predicted anything
Once a quarter, look back. When next steps dropped, did retention follow? When proposal velocity rose, did revenue follow it two quarters later? An indicator that never predicts anything gets replaced. Without this check, a scorecard keeps tracking numbers out of habit.
What are the most common mistakes with leading indicators?
The most common mistakes make the scorecard look complete while it tells the leadership team very little.
- Counting activity and calling it a leading indicator. Calls made and emails sent measure effort. A team can double its call count without moving a single relationship forward.
- Tracking too many numbers. A 20-line dashboard gets reported every week and acted on rarely.
- Leaving numbers undefined. If “next step” means a dated meeting to one rep and “I’ll follow up” to another, the number can’t be trusted.
- Leaving numbers without an owner. A number with no owner gets reported every month and changed by nobody.
- Never testing the connection. If nobody checks whether an indicator predicted revenue, nobody knows which ones to keep.
- Reviewing them only at the quarterly board meeting. Leading indicators are useful because they move fast. Reviewing them once a quarter gives up most of that advantage.
Where to start this week
Start with the first indicator on the list. Pull your top 20 accounts by revenue for the last twelve months, open each one in the CRM, and count how many have a specific next step with a date. Write that number down, put it at the top of next week’s leadership meeting, and ask every account owner to close the gaps before the following week.
That one number usually says more about next year’s revenue than this month’s P&L. Once it’s being reported every week, add the next three.
Ready to grow?
If your monthly numbers tell you what already happened and very little about what’s coming, we can help you build the short list of indicators your leadership team reviews every week.
FAQs
About the Author: David Tisdale
