

Net Revenue Retention: What It Is and How It Predicts Growth

Net revenue retention (NRR) measures how much revenue a company keeps and grows from its existing customer base over a period, expansion included. The formula: NRR = (Starting Revenue + Expansion − Contraction − Churn) ÷ Starting Revenue. A result under 100% means the base shrank even after new sales to existing accounts; a result of 100% or higher means it grew.
TL;DR
- NRR measures the health of the customer base a company already has, separate from new-logo sales.
- The formula: (Starting Revenue + Expansion − Contraction − Churn) ÷ Starting Revenue.
- A company can report flat or growing total revenue while its NRR sits well under 100%, because new customers are quietly covering for a shrinking base.
- SaaS benchmarks (100%+, 120%+ for “best in class”) come from a subscription motion with monthly billing and a contract renewal date. They do not transfer cleanly to a project or order-driven business.
- For a company without subscriptions, NRR still works. It just needs a consistently defined measurement window, like a trailing 12 months applied to every account.
- Gross revenue retention (GRR) and logo retention answer different questions than NRR, and a leadership team that only tracks one of the three is missing part of the picture.
- The actions that move NRR are almost all account management actions: catching contraction early, systematizing expansion, and building a service layer that gives a customer a reason to buy more than parts.
A manufacturer we worked with was proud of a flat year. Revenue had held steady, the team had hit its number, and nobody was asking hard questions. Underneath that flat line, six long-standing accounts had cut their order volume by a third, and two more had stopped ordering altogether after a plant closure.
That is the villain in most conversations about flat revenue: a company reads “flat” as “safe” without checking whether the flat number is made of the same customers doing the same business, or a shrinking core papered over by new logos that cost far more to acquire than the accounts they replaced.
Net revenue retention is the number that catches this before it becomes a crisis. It is a SaaS metric by birth, built for companies that bill monthly and can watch a dashboard update in real time. Most of the explanations of it online assume a subscription, a login, and a renewal date.
A company that sells equipment, parts, projects, or long-cycle contracts does not have any of those things, and that is exactly why this article exists: to show what NRR means, how to calculate it, and how to measure it when “renewal” is a pattern spread across purchase orders, service calls, and multi-year capital cycles, with no single date on a calendar.
What is net revenue retention?
Net revenue retention is the percentage of revenue a company keeps from its existing customer base over a defined period, after accounting for both the revenue it lost from that base and the revenue it gained from selling more to the same accounts. It answers one specific question: if a company sold nothing new to a single new customer this year, would its revenue from the customers it already had be bigger, smaller, or the same?
NRR takes four components and turns them into one ratio:
- Starting revenue: what the existing base generated at the start of the period.
- Expansion revenue: new spending from those same accounts, whether that is a bigger order, a new product line, or an added service contract.
- Contraction: a drop in spending from an account that is still active, still ordering, just ordering less.
- Churn: revenue lost entirely because an account stopped buying.
Defined Term: Net revenue retention (NRR).
The percentage of revenue retained and grown from an existing customer base over a period, calculated as (Starting Revenue + Expansion − Contraction − Churn) divided by Starting Revenue. Also called net dollar retention (NDR) or revenue retention rate.
New customers never enter this calculation. A company can add fifty new logos in a year and its NRR would not move, because NRR is a closed-loop measure of the base it already had. That separation is the entire value of the metric. It isolates whether the company is actually good at keeping and growing what it has already built, independent of how good its sales team is at finding new people to sell to.
How do you calculate NRR?
You calculate NRR by taking the revenue from your existing customer base at the start of a period, adding what those same accounts spent in expansion, subtracting what they cut in contraction, subtracting what they stopped spending entirely in churn, and dividing the result by the starting number.
The formula in full:
NRR = (Starting Revenue + Expansion Revenue − Contraction − Churn) ÷ Starting Revenue
Here is a worked example with round numbers. A company starts the year with $10,000,000 in revenue from its existing accounts.
| Component | Amount |
|---|---|
| Starting revenue (existing base) | $10,000,000 |
| Expansion revenue (upsells, cross-sells, added services) | +$1,200,000 |
| Contraction (reduced orders from active accounts) | −$600,000 |
| Churn (accounts that stopped buying entirely) | −$900,000 |
| Ending revenue from that same base | $9,700,000 |
NRR = ($10,000,000 + $1,200,000 − $600,000 − $900,000) ÷ $10,000,000 = $9,700,000 ÷ $10,000,000 = 97%
That company’s existing customer base is worth 3% less than it was twelve months earlier, even after crediting it for every dollar of expansion revenue. If that company also brought in $1,000,000 in new-logo revenue during the same period, its total revenue would show $10,700,000, a 7% increase over the prior year. The topline number says the company grew. The NRR says the foundation under that growth cracked, and new customers are the only reason it does not show.
Defined Term: Expansion revenue.
Additional revenue generated from an existing customer beyond what they were already spending, whether from a larger order, a new product category, an added service tier, or a price increase they accepted without objection.
How does NRR differ from gross revenue retention and logo retention?
NRR, gross revenue retention (GRR), and logo retention each measure a different slice of the same customer base, and reading only one of them hides what the other two would show. NRR includes expansion and can rise above 100%. GRR excludes expansion and caps at 100%, showing the worst-case floor of what the base would be worth with zero upsell activity. Logo retention ignores dollars entirely and just counts how many accounts stayed versus left.
Defined Term: Gross revenue retention (GRR).
The percentage of revenue retained from an existing customer base after subtracting contraction and churn, with expansion revenue excluded from the calculation. GRR = (Starting Revenue − Contraction − Churn) ÷ Starting Revenue, and it never exceeds 100%.
Run the same worked example through GRR: ($10,000,000 − $600,000 − $900,000) ÷ $10,000,000 = $8,500,000 ÷ $10,000,000 = 85%. That is a full 12 points lower than the 97% NRR. The gap between the two numbers is entirely the expansion revenue, and a wide gap is itself a signal: it means growth from the existing base is coming almost entirely from a handful of accounts buying more, while the majority of the base is stable at best.
Logo retention would tell a third story again. If that same company started the year with 40 active accounts and ended with 36, its logo retention is 36 ÷ 40 = 90%. That number says nothing about whether the four lost accounts were the company’s smallest customers or its largest. A company can lose one large account and ten small ones and still post a respectable logo retention number while its revenue-based retention collapses.
| NRR | GRR | Logo Retention | |
|---|---|---|---|
| What it measures | Dollars retained plus expansion | Dollars retained, expansion excluded | Accounts retained, regardless of size |
| Formula | (Start + Expansion − Contraction − Churn) ÷ Start | (Start − Contraction − Churn) ÷ Start | Accounts retained ÷ Starting accounts |
| Can it exceed 100%? | Yes | No | No |
| What it hides | Whether growth is broad-based or concentrated in a few accounts | Any upside from expansion | Revenue size of the accounts that left |
| Best used for | Overall base health and growth trajectory | A worst-case floor, useful for planning | Relationship count and concentration risk |
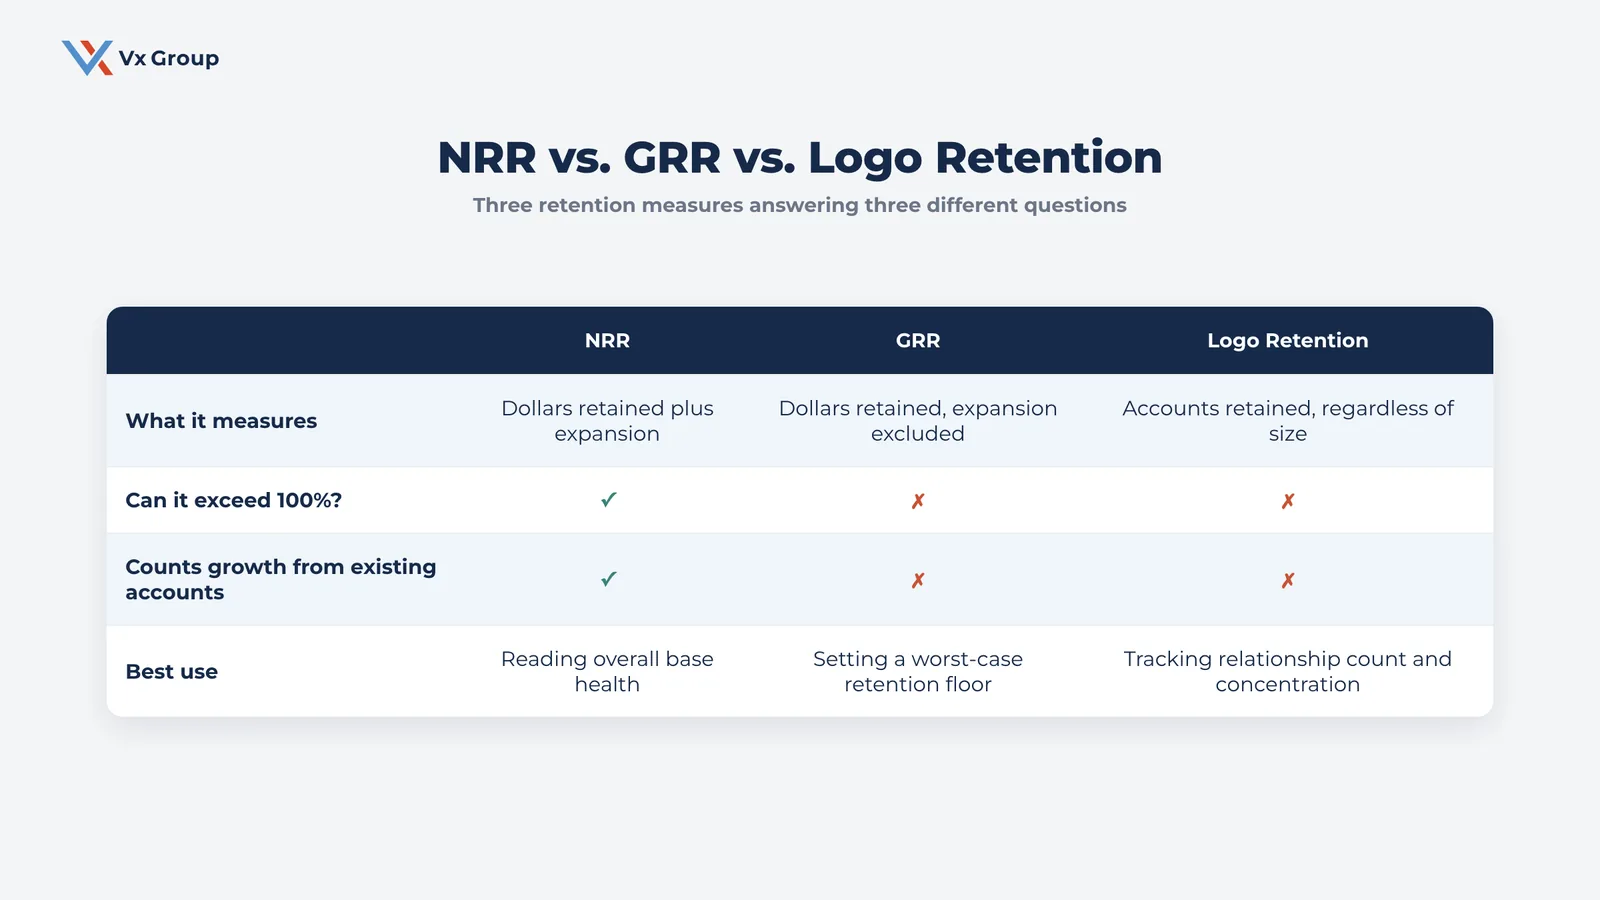
A leadership team that wants the real picture tracks all three. NRR shows the trend, GRR shows the floor, and logo retention shows whether the losses and gains are spread across the base or concentrated in a few relationships. Reading only NRR can mask a real customer concentration problem sitting underneath a healthy-looking percentage; anyone building out the base health picture should pair this with how the top of that base is concentrated, covered in Customer Concentration Risk.
Ready to grow?
If you want a second set of eyes on what your NRR, GRR, and logo retention numbers actually say about your base, we will walk through the math with you.
What is a good NRR for a relationship-driven B2B company?
A good NRR for a relationship-driven B2B company generally sits between 90% and 105%, well below the 110% to 130%+ range that SaaS benchmarking reports treat as standard. The SaaS number comes from a different kind of business, and applying it here sets a target that has little to do with how this kind of company actually grows.
SaaS benchmarks are built around low-friction expansion. A subscription customer can add a seat, upgrade a tier, or turn on a new module inside the same login, in the same week they had the idea. That is why a well-run SaaS company can push NRR past 120%: expansion happens constantly and costs almost nothing to execute. A relationship-driven B2B company selling equipment, parts, projects, or long-cycle contracts runs on a different lever entirely.
Expansion here usually means a new capital project, a new plant line, or a new product category, and those decisions move on the customer’s budget cycle and capital approval process. Expecting SaaS-level NRR from a business built this way is comparing two different growth engines and grading one against the other’s scoreboard.
That is also why a company in this world should treat 100% NRR as a genuinely strong result. Holding the existing base flat while absorbing normal churn (a plant closure, a competitor’s price play, a customer that gets acquired and consolidates its vendor list) and offsetting it with real expansion is a sign of a well-managed account base.
A reading in the mid-90s is common and stable year-over-year performance in that range should read as healthy. What matters more than hitting a specific target is the trend: an NRR drifting downward for two or three years running means the base is eroding faster than the company is expanding it, regardless of whether the number crosses some arbitrary SaaS-derived threshold.
The other reason SaaS benchmarks mislead here is deal size and cycle length. A SaaS company with thousands of small accounts can smooth out one lost customer inside its aggregate NRR. A company with 40 or 60 core accounts, where the top ten carry the majority of revenue, will see its NRR swing hard on the loss or expansion of a single account. That volatility is normal for a concentrated base, and it argues for reading NRR alongside account-level detail on the specific accounts driving the swing.
How do you calculate NRR for a project-based or order-driven business?
You calculate NRR for a project or order-driven business the same way you calculate it for a subscription business, with one change: instead of using a contract renewal date to define the measurement period, you use a fixed trailing window (usually 12 months) applied consistently across every account, pulled from actual order and invoice history in your ERP or CRM.
A subscription company has a natural clock: the contract renews on a specific date, and everything before and after that date is a clean before/after comparison. A company selling parts, equipment, or services has no such date. A distributor’s customer might place four small orders and one large one in a year, with no single moment that counts as “the renewal.” The measurement period has to be defined deliberately: a fixed window, applied the same way to every account, every time.
Here is a full worked example for exactly this kind of business.
Ridgeline Fasteners (illustrative) is a mid-market industrial distributor supplying fasteners, machined parts, and maintenance service contracts to manufacturing plants. It has 42 active accounts and no subscriptions. To calculate NRR, Ridgeline defines its measurement period as a trailing 12 months and pulls order history for every account active in the prior 12-month window.
| Component | Amount |
|---|---|
| Starting revenue (accounts active in the base period) | $12,000,000 |
| Expansion (accounts that added product lines, increased volume, or added a service contract) | +$900,000 |
| Contraction (accounts still ordering, but at lower volume due to a slow production quarter) | −$500,000 |
| Churn (two accounts: one lost to a competitor, one plant closure) | −$1,100,000 |
| Ending revenue from that same base | $11,300,000 |
NRR = ($12,000,000 + $900,000 − $500,000 − $1,100,000) ÷ $12,000,000 = $11,300,000 ÷ $12,000,000 = 94.2%
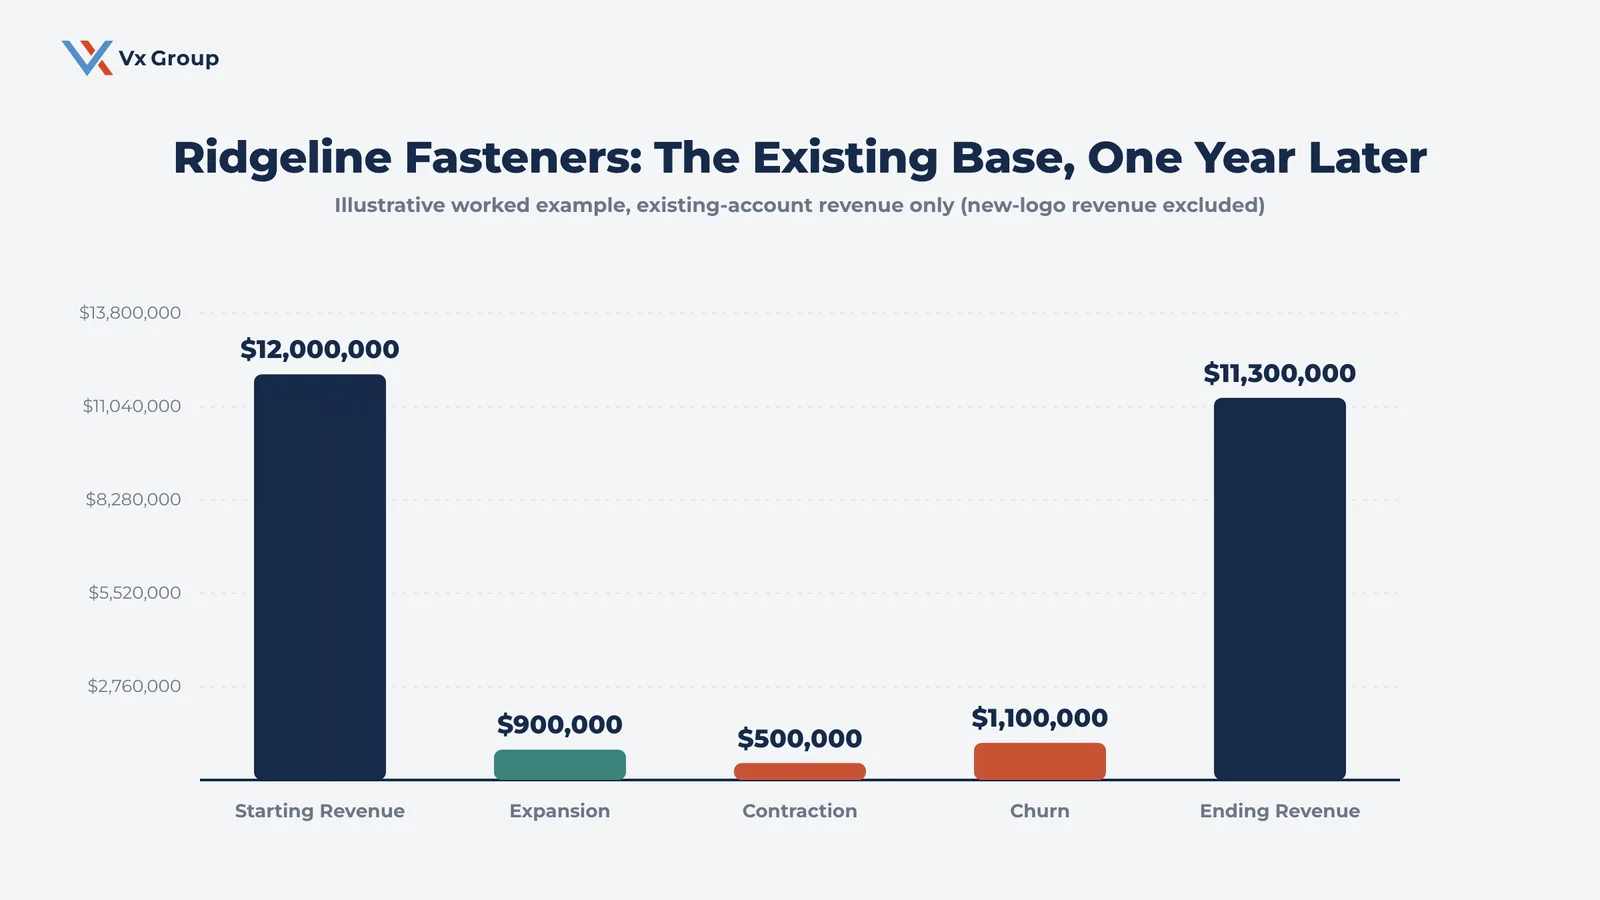
In the same period, Ridgeline signed six new accounts worth $1,400,000. Total revenue for the year came in at $12,700,000, up 5.8% from the prior year’s $12,000,000. On a total-revenue basis, the year looks like solid growth. The 94.2% NRR tells a different part of the story: the base Ridgeline already had is shrinking, and new-account revenue, which typically costs several times more to generate than a dollar of expansion from an existing relationship, is the only thing keeping the topline positive.
Set the measurement window before you calculate anything
Pick a single trailing window (12 months is standard) and apply it to every account without exception. Mixing windows, using calendar year for some accounts and fiscal year for others, produces a number that cannot be compared period over period.
Separate lumpy capital purchases from the recurring revenue base
A customer that buys a $400,000 piece of equipment once every four years will look like a churn event in the three years it doesn’t buy, even though the relationship is intact. Run NRR twice: once on the full account base, and once on recurring categories only (parts, consumables, service contracts), so a lumpy capital cycle does not get misread as an account walking away. Flag any account with a known multi-year purchase cycle before you run the calculation.
Build the buckets from real order and invoice data
Build the starting/expansion/contraction/churn buckets from actual invoice and purchase-order data in the ERP or CRM, categorized by account. A sales team’s gut read on “who’s growing and who’s shrinking” is frequently wrong in ways that only show up once someone runs the real numbers.
Classify every account into one of four buckets every period
Every account in the base falls into exactly one of four categories each measurement period: expanded, flat, contracted, or churned. Assigning every account to one of the four buckets shows exactly which specific relationships are moving in which direction each period.
What actions actually move NRR?
The actions that move NRR are account management actions: catching contraction while an account is still active, building a repeatable process for expansion instead of leaving it to chance, and giving customers a reason to buy more than the base product.
- Build an early-warning system for contraction. A 15% order-volume drop from a long-standing account is a signal worth a phone call within the week, before the quarter closes and the drop turns into a full account loss. Set a threshold (a percentage drop over a trailing quarter, for example) that triggers a named person making that call.
- Put a name and a cadence on account expansion. If expansion only happens when a salesperson happens to notice an opportunity, it will happen inconsistently. Assign account owners a defined touchpoint schedule and a specific expansion target per account, the same way a sales team tracks new-logo quota. Our Account Expansion piece goes deeper on how to build this system.
- Add a service layer that a competitor can’t easily match. A maintenance contract, a technical support line, or a stocked-parts program gives a customer a reason to stay engaged between large purchase cycles, and it is one of the more reliable sources of expansion revenue in a project-based business.
- Review the top 10 to 20 accounts by revenue every quarter, individually. Aggregate NRR can look fine while two or three of your largest relationships are quietly at risk. A named account-by-account review catches what the aggregate number hides.
- Diagnose base erosion before adding more new-logo spend. If NRR has been sliding for two years, find and fix the reason before increasing the new-logo target. New-logo revenue consistently costs more to generate than a dollar of expansion from an account that already trusts the company. Our Customer Retention Strategies and How to Improve Customer Retention articles cover the tactical side of this in more depth.
None of this requires a subscription model or a SaaS-style dashboard. It requires treating the existing customer base as an asset that gets actively managed, the same discipline a company already applies to its new-business pipeline.
Where NRR fits in the bigger picture
Net revenue retention is one input into a larger question every relationship-driven B2B company should be asking on a regular basis: is growth this year coming from the relationships we already have, or from a constant hunt for new ones to replace the ones we’re losing.
A company that only tracks total revenue can go years without noticing the difference. A company that tracks NRR alongside GRR and logo retention catches the erosion while there is still time to do something about it.
That question gets sharper the more concentrated the customer base is. Most companies in this world sell to a few dozen accounts that each carry real weight, which is why the account-level detail behind the NRR number matters as much as the number itself.
Ready to grow?
We help relationship-driven B2B companies build the account management systems that keep NRR moving in the right direction, without borrowing a playbook built for a business model that doesn’t match theirs.
FAQs
About the Author: Jacob Camhi
